Replication 02 · American Economic Review, 2001
The Colonial Origins of Comparative Development
How much of the income gap between countries is caused by differences in institutions?
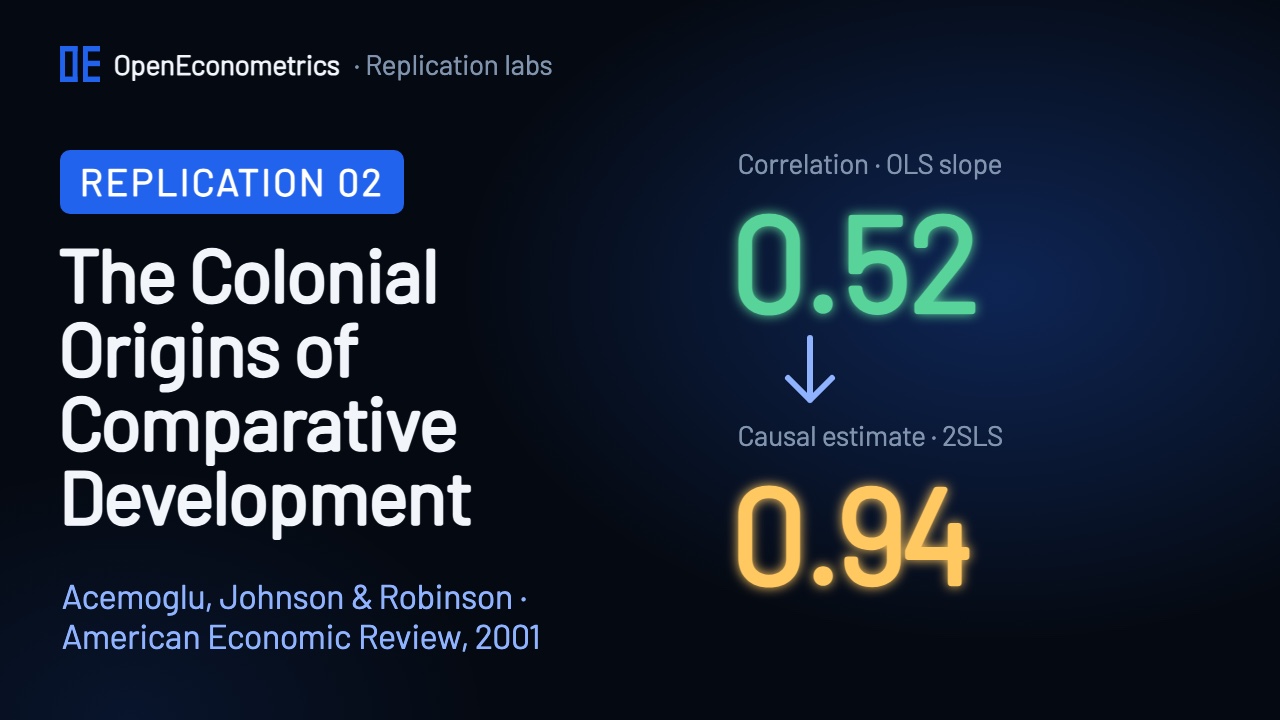
In 1995 the average person in the United States produced about $27,000 a year; in Ethiopia, about $450. Do institutions cause gaps like this? Acemoglu, Johnson and Robinson used the death rates that European settlers faced centuries ago as an instrument for institutions today. This lab reruns every regression in the paper's eight tables from the authors' own data and Stata programs in OpenEconometrics, compares 863 printed numbers with the run, and adds the weak-instrument checks that econometrics has developed since.
A strong correlation
Countries that protect property from expropriation are richer. Across the 64 former colonies in the paper's base sample, an ordinary least squares regression of log GDP per person in 1995 on the average protection against expropriation risk, an index from 0 to 10 for 1985–1995, gives a slope of 0.52: one point more on the index goes with about 69% higher income.
That slope cannot be read as the effect of institutions. Richer countries can afford better institutions (reverse causality). Geography, climate or culture may shape both (omitted variables). And the index is a noisy measure of institutions, which pulls the OLS slope toward zero (measurement error). We do not even know which way the estimate is biased.
Settler mortality as an instrument
The authors' answer comes from colonial history. Where European settlers could survive, as in Australia, New Zealand or the United States, they settled in large numbers and built institutions that protected property, because they would live under them. Where malaria and yellow fever killed settlers, colonizers set up extractive states to move resources out. Institutions persisted after independence. So the mortality that settlers faced, centuries ago, predicts institutions today.
The mortality rates come from the deaths of soldiers, bishops and sailors stationed in the colonies, largely collected by the historian Philip Curtin. They range from about 8.5 deaths per 1,000 per year in Australia and New Zealand to almost 3,000 in Mali, so the paper uses their logarithm.
An instrument must satisfy two conditions. Relevance: settler mortality must move institutions, which the first stage tests. Exclusion: settler mortality must affect income today only through institutions. That cannot be tested directly; it has to be argued and probed.
The first stage and the reduced form
The first-stage slope is −0.61 with a standard error of 0.13: places where settlers died at higher rates have weaker protection against expropriation today. Settler mortality alone explains 27% of the variation in institutions across the 64 countries, so the instrument is relevant.
Regressing income directly on settler mortality gives a slope of −0.573. With a single instrument, two-stage least squares is exactly the ratio of the reduced form to the first stage: −0.573 ÷ −0.607 = 0.944. The run checks that identity to ten decimal places.
Two-stage least squares
| Table 4, column 1 · base sample | Paper | This lab |
|---|---|---|
| Panel A · 2SLS · institutions | 0.94 (0.16) | 0.9443 (0.1565) |
| Panel B · first stage · log settler mortality | −0.61 (0.13) | −0.6068 (0.1267) |
| Panel B · R² | 0.27 | 0.2701 |
| Panel C · OLS · institutions | 0.52 (0.06) | 0.5221 (0.0612) |
| Observations | 64 | 64 |
The two-stage least squares estimate, 0.94 with a standard error of 0.16, is larger than OLS (0.52). If reverse causality were the main problem, IV would be smaller; the authors attribute the gap mainly to measurement error in the institutions index, which pulls OLS toward zero.
The paper illustrates the size with Nigeria and Chile. Chile scores 7.82 on the index and Nigeria 5.55. The gap of 2.27 points times 0.944 is 2.15 log points, an 8.6-fold difference in income; the paper writes "as much as a 7-fold increase", and we keep that difference visible. In the data, Chile is about 12.5 times as rich as Nigeria.
Probing the exclusion restriction
Settler mortality might reach income through other channels: geography, the identity of the colonizer, legal origin, religion, or the disease environment today. Tables 4 to 7 add these channels as controls, or change the sample.
Without the neo-Europes (the United States, Canada, Australia and New Zealand) the estimate rises to 1.28; without Africa it falls to 0.58; with continent dummies it is 0.98. Controls for the colonizer, legal origin, religion, temperature and humidity, ethnolinguistic fragmentation, malaria and life expectancy move it between about 0.6 and 1.3, and every 95% interval stays above zero.
Table 8 adds a second instrument, such as the share of Europeans in 1900. None of its ten overidentification tests rejects at the 5% level (p-values from 0.09 to 0.96), and all ten match the paper. These tests only check whether two instruments agree; they cannot prove that either is valid.
Modern checks
With the same data, OpenEconometrics adds three checks that the paper did not report. The heteroskedasticity-robust standard error of the main estimate is 0.18, against the conventional 0.16. The Montiel Olea–Pflueger effective F statistic is 16.3: above the critical value for a 20% worst-case bias (15.1) but below the one for 10% (23.1), so the first stage is reasonably strong but not overwhelming. The Anderson–Rubin 95% confidence set, valid however weak the instrument, runs from 0.70 to 1.43: it excludes zero and sits slightly above the usual interval of 0.63 to 1.26.
The settler-mortality data themselves have been debated. Albouy (2012, American Economic Review) argued that many rates are imputed from neighbouring countries or measured on soldiers during campaigns; the authors' reply in the same issue argued that the results survive once outliers and data choices are handled. This lab replicates the 2001 paper with its original data. Whether the instrument is valid is an argument about history, which a replication can sharpen but not settle.
The scorecard
| Target | Paper | This lab | Result |
|---|---|---|---|
| Table 4 · 2SLS · institutions | 0.94 (0.16) | 0.9443 (0.1565) | ✓ Match |
| Table 4 · first stage · settler mortality | −0.61 (0.13) | −0.6068 (0.1267) | ✓ Match |
| Table 4 · OLS · institutions | 0.52 (0.06) | 0.5221 (0.0612) | ✓ Match |
| Table 8 · overidentification p-values | 0.09 to 0.96 | 10 of 10 match | ✓ Match |
| All eight tables | 863 numbers | 669 match · 77 rounding · 117 differ | Difference |
| Table | Numbers | Match | Rounding | Differ |
|---|---|---|---|---|
| Table 1 · Summary statistics | 76 | 67 | 1 | 8 |
| Table 2 · OLS regressions | 52 | 16 | 2 | 34 |
| Table 3 · Determinants of institutions | 100 | 80 | 19 | 1 |
| Table 4 · IV regressions | 112 | 102 | 9 | 1 |
| Table 5 · IV with colonial controls | 123 | 85 | 10 | 28 |
| Table 6 · IV robustness | 122 | 71 | 14 | 37 |
| Table 7 · Geography and health | 148 | 134 | 11 | 3 |
| Table 8 · Overidentification | 130 | 114 | 11 | 5 |
| All eight tables | 863 | 669 | 77 | 117 |
Of the 863 numbers printed in the eight tables, 669 match at the printed precision. Another 77 match under a documented alternative rounding convention: 52 after rounding to two significant digits, 14 after truncation and 11 after double rounding. These are recorded separately from exact matches. The remaining 117 differ, and each one is kept with a diagnosis:
- 52 from samples in the posted data. Table 2's whole-world sample has 111 countries against 110 printed, and the authors' do-file notes that the extra country is unknown. Table 6's soil variables are complete for all 64 countries, where the notes describe 63.
- 26 from the paper itself: columns printed twice, the same regression printed as 0.41 in Table 2 and 0.40 in Table 4, a sign error, and conventional standard errors where the posted do-file asks for robust ones.
- 12 from data versions and coding. An earlier version of the authors' program says that Table 1 cannot be reproduced exactly, and the continent dummies are coded differently in the posted file.
- 27 unexplained, 18 of them in a single column, Table 5 column 9.
Table 4, column 1 in all three panels, and all ten overidentification tests match at the printed precision. Across Table 4's 112 numbers, 102 match at the printed precision, nine match under an alternative rounding convention and one differs.
Where this replication stops
The lab reruns every regression in Tables 1 to 8 with OpenEconometrics estimators and compares the results with the printed tables; Stata itself was not run. The paper's figures are not redrawn as images, but their data are exported, and the three scatter plots on this page use them. The 2012 exchange over the mortality data is described here, not replicated.
Run it yourself
The lab package and the companion video will be published here. You will need the authors' files, which we never redistribute:
- Run
prepare_sources.pyfrom the lab package. It downloads the eight table files from Daron Acemoglu's data archive at MIT and checks each one against its recorded SHA-256 fingerprint. - Open a Python document in OpenEconometrics, point the launcher at the lab, the authors' files and a new results folder, and press Run.
from lab import run_lab

result = run_lab(
    source_root=source_dir,
    output_dir=results_dir,
    display_callback=display,
)
The main estimate is one call:
iv = oe.ivregress(data=base, y="logpgp95", endog=["avexpr"], instruments=["logem4"])The run writes reconciliation.csv, with every published number next to the lab's result.
The paper
Daron Acemoglu, Simon Johnson and James A. Robinson, "The Colonial Origins of Comparative Development: An Empirical Investigation", American Economic Review 91(5), 1369–1401, 2001. doi:10.1257/aer.91.5.1369. The paper, the authors' data and code keep their own rights; this page and the lab describe and recompute them.