OpenEconometrics

Econometrics.
On your terms.
With your agent.

Write Python or ask your AI agent. Fit 170+ estimators and publish the results, in an open-source workspace that runs on your own computer.

Download Desktop App
pip install openecon
Watch the launch filmYouTube · 1 min 23 s
wage = 3.09 + 1.73 education + 0.42 experience OLS with HC3 errors on the bundled example data, fitted by openecon. 480 observations, R² 0.825.

Write Python. Hit run.

Code, data and results stay side by side. The Python session keeps its variables between runs, and every table, chart and LaTeX export comes from the same saved result.

OpenEconometrics/ wage-studyLocal Python, ready
analysis.py
1import openecon as oe
2
3df = oe.example()
4model = oe.ols(
5    data=df, y="wage",
6    x=["education", "experience"],
7    covariance="HC3",
8)
9display(model)

Completed in 0.16 s

OLSwage480 observations
HC3 standard errors95% CIR² = 0.8253
TermEstimateStd. err.tCI lowerCI upper

Workbench mock-up. The numbers are real openecon output for the bundled synthetic example.

170+ estimators. One PyTorch core.

From OLS to panels, time series and difference-in-differences, 171 registered estimators share one float64 PyTorch core. statsmodels and SciPy are not required at runtime.

The method guides also cover Bayesian MCMC and BVAR, item response theory, SEM and CFA, meta-analysis, multiple imputation, survey designs and seasonal adjustment.

Robust inference, built in.

Change the covariance and the standard errors, intervals and tests update from the same fit. Margins and predictions work on the saved result.

covariance="HC3"
oe.margins(model)
Average marginal effect of education: 1.729
oe.predict(model, new)
Fitted wages for new rows, from the saved result
Coefficients and 95% intervals
TermEstimateStd. err.95% interval

Heteroskedasticity-robust HC3 errors.

Network analysis, too.

Build a graph from an edge table, then score it: degree, PageRank, eigenvector centrality and Leiden communities. The algorithms are sparse and native, with no dense node-by-node matrix.


Publication-ready in one click.

Every saved result exports as a LaTeX table with its notes, and every chart as SVG, PNG or CSV. The preview and the source share the same numbers.

Table 1: Regression results

Dependent variable:wage
(1)
education1.7289***
(0.0455)
experience0.4183***
(0.0160)
Constant3.0922***
(0.6876)
Observations480
R20.8253
Adjusted R20.8246

Notes: Standard errors are in parentheses. HC3 heteroskedasticity-robust standard errors. * p < 0.10; ** p < 0.05; *** p < 0.01.

Bring your AI agent.

Connect Codex, Claude or another MCP client to a local workspace. Agents inspect data, fit models and return LaTeX through ten structured tools, and they never run arbitrary code.

In the desktop app, open a project and choose Connect agent to copy a ready command.


Work as a team.

Invite teammates as owners, editors or viewers. Code, data and results sync automatically, while every analysis still runs on each person's own computer.

Team projects need a sign-in. Local projects need no account.

Famous papers, rebuilt step by step.

Replication labs start from the authors’ own research files and rebuild a published paper’s results in OpenEconometrics, with a number-by-number scorecard against the paper.

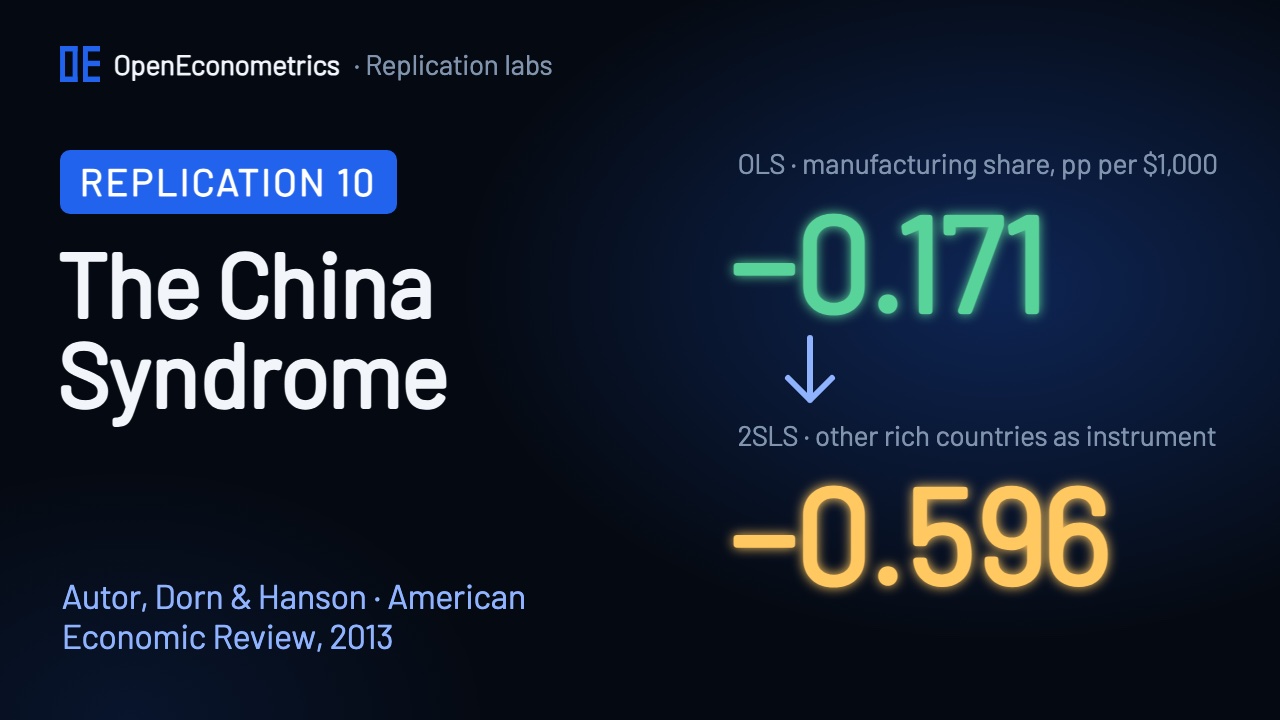
Replication 10 · American Economic Review, 2013

The China Syndrome

David H. Autor, David Dorn, Gordon H. Hanson

Did imports from China cost American factory jobs? Autor, Dorn and Hanson (2013) rebuilt in OpenEconometrics, every standard error scored two ways.

Shift-share exposure · instrumental variables · two-stage least squares · stacked first differences · clustered standard errors · pre-period placebo · Lab package coming soon · Video lesson · 20:54

All replication labs

Learn econometrics.

From your first data question to regression, causal inference and time series. Follow a learning path, then try a worked lab.

Open the econometrics hub · Find a method for your question · Read the blog

Two open-source Python libraries.

openecon

Statistics and econometrics on one PyTorch float64 core, from the console, scripts or notebooks.

pip install openecon

openecon-charts

Interactive D3 charts for Python, with legends, tooltips and SVG, PNG or CSV export.

pip install openecon-charts

Free. Open source. AI-native.

The OpenEconometrics alpha is ready to try. Download the desktop app or install the Python library.

Download Desktop App
pip install openecon