Replication 03 · Quarterly Journal of Economics, 2022
Taxation and Innovation in the Twentieth Century
How did personal and corporate income taxes affect patents, citations and inventors in U.S. states between 1940 and 2000?
Do taxes change how much a country invents? Akcigit, Grigsby, Nicholas and Stantcheva built new historical data on patents, inventors and state corporate taxes to answer that question for the United States over the twentieth century. This lab rebuilds the paper's state-level results, Tables II and III and the data behind Figures I, II and IV, from the authors' public files in OpenEconometrics, and checks every number twice: against the published paper and against the authors' own Stata logs.
A panel of states and years
The data are a panel of 47 U.S. states over 61 years, 1940 to 2000: 2,867 state-years. The mainland states are included except Louisiana, whose tax data for 1975–1982 are unreliable. Innovation is measured four ways: the log number of patents, of citations to those patents and of inventors, and the share of patents assigned to companies rather than to individuals.
Two tax rates combine federal and state law. MTR90 is the marginal income tax rate of a person at the 90th percentile of the national income distribution, computed with Jon Bakija's tax calculator. The corporate MTR is the top marginal corporate income tax rate, from the authors' new historical database.
Top corporate MTRPersonal MTR90
The top corporate rate jumped from about 26% in 1940 to 45% in 1941 and stayed around 50% from the early 1950s until the mid-1980s. The personal MTR90 rose from 5% in 1940 to a peak of about 52% in 1981. The Tax Reform Act of 1986 cut both to the high thirties. Most of these swings come from federal law and hit every state; the regressions use the part that differs between states.
What you keep: the net-of-tax rate
The paper's regressors are the logs of the net-of-tax rates, ln(1 − MTR90) and ln(1 − corporate MTR): what an inventor or a firm keeps from an extra dollar. A cut in a tax rate from 40% to 30% raises the net-of-tax rate from 60 to 70 cents, a log change of 0.154. With innovation also in logs, each coefficient is an elasticity: the percentage change in innovation for a 1% rise in what is kept.
The regression
Equation (3) of the paper regresses each outcome on both log net-of-tax rates, lagged three years, with state and year fixed effects. Controls are lagged population density, real personal income per person and R&D tax credits. States are weighted by their population in 1940, and standard errors are clustered two ways, by year and by state × five-year period. State effects remove permanent differences between states; year effects remove everything that hits all states at once, including federal tax changes that apply equally everywhere.
oe.reghdfe(data=panel, y="lnpat",
           x=["mtr90_lag3", "top_corp_lag3", "L_real_gdp_pc", "L_population_density", "rd_credit_lag3"],
           absorb=["statenum", "year"], weights="pop1940", weight_type="aweight",
           cluster=["state_fiveyear", "year"])
The main result
Personal tax in blue, corporate tax in amber. The share assigned is a semi-elasticity.
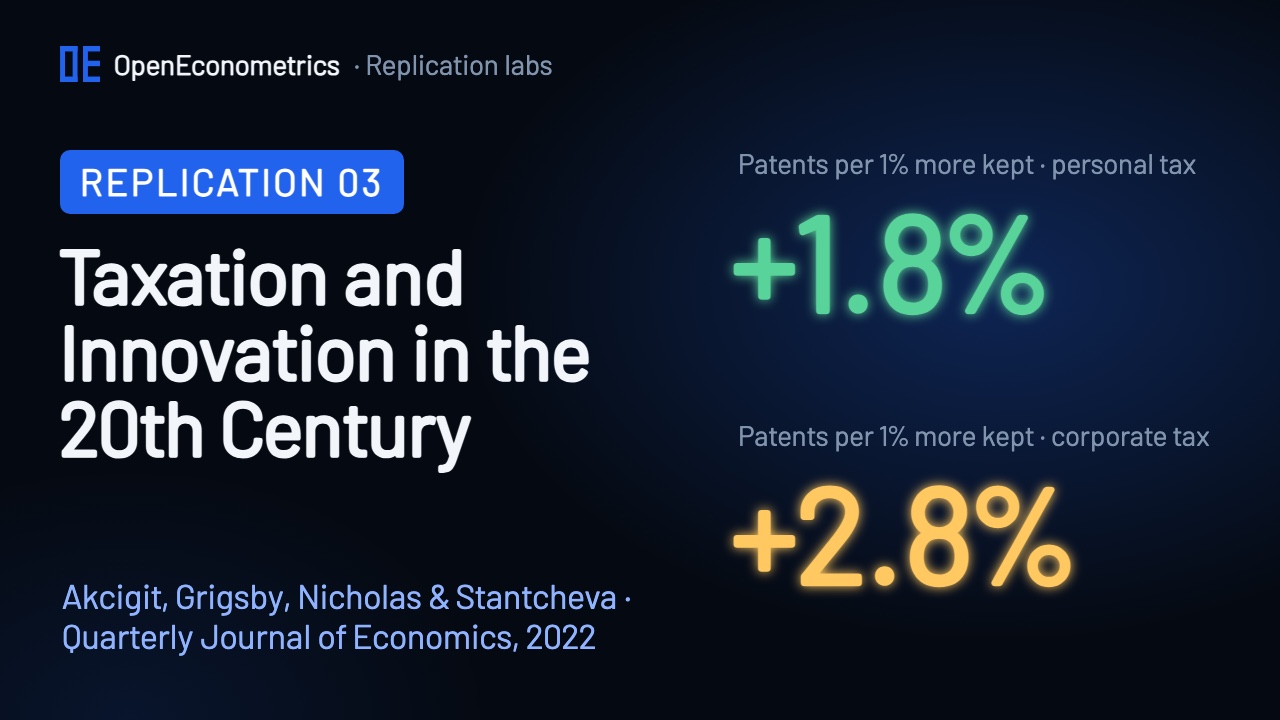
A 1% rise in the personal net-of-tax rate goes with about 1.8% more patents (1.803, standard error 0.450) and as many more inventors; a 1% rise in the corporate net-of-tax rate goes with about 2.8% more patents (2.759). Citations respond almost as strongly. The share of patents assigned to companies responds to the corporate tax but not to the personal tax. In the 40% → 30% example, 0.154 × 1.803 = 0.28 log points: about 32% more patents in that state. These are still correlations within states over time; a state that cuts taxes may change other policies too.
Each dot is the population-weighted average of residualized log patents within one of 100 bins of the residualized tax variable. The authors' logged figure uses an unweighted regression of the residuals, with slope 2.209. The line shown here instead uses population weights and has slope 1.803: by the Frisch–Waugh–Lovell theorem, this weighted regression reproduces the Table II coefficient, and the run checks it. The fitted line is therefore an adaptation, not an exact reproduction of the authors' figure.
The corporate tax base
A corporate tax rate is not the whole corporate tax: what counts as taxable profit differs between states and over time. Panel B adds an index of the breadth of each state's corporate tax base and its interaction with the corporate rate, for the 2,256 state-years from 1953 on where the index exists. The personal and corporate elasticities barely move (1.967 and 2.376), and the positive interaction (0.220) means that innovation responds more strongly to the corporate rate in states with broader tax bases.
An instrument from federal law
A state that cuts taxes may change other policies at the same time, or cut them because its economy is doing well. The instrument holds each state's own tax law fixed at its level five years earlier and lets only federal law change. Because federal tax is deductible from state tax in some states and states start from different rates, the same federal change moves each state's total tax rate differently. That variation comes from Washington, not from the state's own economy.
| Outcome | OLS · personal | IV · personal | OLS · corporate | IV · corporate |
|---|---|---|---|---|
| Log patents | 1.803 (0.450) | 2.294 (0.956) | 2.759 (0.701) | 3.540 (0.943) |
| Log citations | 1.516 (0.507) | 1.976 (1.083) | 2.382 (0.770) | 2.793 (1.047) |
| Log inventors | 1.784 (0.427) | 2.281 (0.893) | 2.308 (0.640) | 3.015 (0.866) |
| Share assigned | 0.056 (0.071) | −0.173 (0.150) | 0.573 (0.141) | 0.665 (0.208) |
The IV elasticities are larger than OLS: 2.294 for the personal and 3.540 for the corporate tax, with wider intervals because the instrument uses only the federal part of the variation. The first stage is strong: the Kleibergen–Paap F statistic for the two first stages together is 32.4. The OLS results do not seem to be driven by states setting their taxes in response to their own economy.
Long differences
Instead of fixed effects, Table III compares how much each state's patents changed over 20, 15 or 10 years with how much its taxes changed. The personal elasticity is 1.45 over 20 years, 1.09 over 15 and 0.78 over 10; the corporate one is 1.98, 1.51 and 1.32. The shorter the horizon, the smaller the effect: innovation responds to taxes slowly.
The scorecard
| Target | Paper | This lab | Result |
|---|---|---|---|
| Table II · A · log patents · personal | 1.803 (0.450) | 1.8031 (0.4498) | ✓ Match |
| Table II · A · log patents · corporate | 2.759 (0.701) | 2.7586 (0.7013) | ✓ Match |
| Table II · C · IV · personal | 2.294 (0.956) | 2.2942 (0.9557) | ✓ Match |
| Table II · C · IV · corporate | 3.540 (0.943) | 3.5403 (0.9431) | ✓ Match |
| Table III · A · 20-year · personal | 1.452 (0.117) | 1.4516 (0.1172) | ✓ Match |
| Tables II and III · every printed number | 184 | 184 of 184 match | ✓ Match |
| Significance stars | 56 | 56 of 56 match | ✓ Match |
| Authors' logs · Tables II and III | 168 | 168 of 168 match | ✓ Match |
| Authors' logs · Figures I, II and IV | 268 | 268 of 268 match | ✓ Match |
| First-stage F, personal tax (log) | 46.47 | 47.48 | Difference |
All 184 numbers in Tables II and III match the published paper at the printed precision, and so do all 56 significance stars. The authors' logs print more digits, and all 168 numbers they contain match as well; Panel A of Table II is missing from them because that regression was switched off in the logged run. The data behind Figures I, II and IV add 268 more numbers, all matching the logs.
Only four numbers differ: statistics on the strength of the first stage, such as the personal tax's F statistic (47.48 here, 46.47 in the log). Stata's ivreg2 counts the 60 year dummies as regressors, while estimators that absorb fixed effects do not; rescaled by 2,755 / 2,815, all four match the log. The coefficients and standard errors are unaffected. The notes under Table II swap the names of Panels B and C; the table and the text agree with each other, and the lab follows them.
Where this replication stops
The paper also estimates inventor-level models (Tables IV to VI) that separate how much each inventor produces from where inventors and firms choose to locate. They need a 348 MB inventor-level file and are not part of this lab, nor are the event studies of Figure III and the appendix tables.
That matters for interpretation. A state-level elasticity includes inventors and firms moving between states, and those moves cancel out for the country as a whole, so it is not the effect of a federal tax change. The paper finds that the state-level effect of corporate taxes comes mostly from relocation, while personal taxes also change how much each inventor produces.
Run it yourself
The lab package and the companion video will be published here. The authors' files are public domain (CC0) on Harvard Dataverse:
- Run
prepare_sources.pyfrom the lab package. It reads only the state data, the programs and the logs from the authors' Dataverse archive, about 1 MB of a 344 MB file, and checks each file against its recorded SHA-256 fingerprint. - Open a Python document in OpenEconometrics, point the launcher at the lab, the authors' files and a new results folder, and press Run.
from lab import run_lab

result = run_lab(
    source_root=source_dir,
    output_dir=results_dir,
    display_callback=display,
)
The run writes reconciliation.csv, with every published number and every number from the authors' logs next to the lab's result.
The paper
Ufuk Akcigit, John Grigsby, Tom Nicholas and Stefanie Stantcheva, "Taxation and Innovation in the Twentieth Century", Quarterly Journal of Economics 137(1), 329–385, 2022. doi:10.1093/qje/qjab022. Data: doi:10.7910/DVN/SR410I, CC0 1.0. The authors ask that users of the data cite the paper.