Library
Every learning page on the site in one place. Search by topic or method, or filter by kind of page.
130 pages
-
Explainer
What is data analysis? A practical introduction with examples
Data analysis turns observations into answers. Learn the steps, common types of analysis and how to turn a question into a defensible conclusion.
-
Explainer
Descriptive vs inferential statistics: the difference with examples
Descriptive statistics summarise observed data; inference makes claims beyond them. Compare examples, confidence intervals and the assumptions behind each.
-
Explainer
Econometrics vs statistics: how they differ and overlap
Econometrics and statistics share methods. Compare their questions, assumptions and uses, with an example that separates prediction from a causal effect.
-
Explainer
What is econometric analysis? From question to evidence
Econometric analysis connects an economic question to data, a model and defensible conclusions. Follow a practical workflow with a policy-evaluation example.
-
Explainer
Exploratory data analysis: what to check before fitting a model
Exploratory data analysis checks a dataset's structure, missing values and unusual observations. Follow a practical checklist before choosing a model.
-
Explainer
What is time series analysis? Patterns, models and forecasting
Time series analysis studies observations recorded over time. Learn about trends, seasonality, stationarity and how to evaluate forecasts without leakage.
-
Explainer
How to read regression results: coefficients, uncertainty and fit
Read a regression table in context: check the sample and units, interpret coefficients and confidence intervals, compare models and separate fit from causality.
-
Explainer
Instrumental variables explained: relevance, exclusion and weak instruments
What instrumental variables need to work, how two-stage least squares uses them, and what a simulation shows weak instruments do to 2SLS.
-
Explainer
Difference-in-differences explained: parallel trends in pictures
How difference-in-differences turns four averages into a causal estimate, what parallel trends means and why the standard errors must be clustered.
-
Explainer
Regression discontinuity explained: estimating effects at a cutoff
How regression discontinuity turns a cutoff rule into a causal estimate, with a simulated example, bandwidth choice and a manipulation check.
-
Explainer
What is heteroskedasticity? How to spot it and what to do
Heteroskedasticity means the error variance changes across observations. Learn to spot it with plots and tests, and how to fix your inference.
-
Explainer
Logit and probit explained: modelling yes-or-no outcomes
Why a straight line struggles with yes-or-no outcomes, how logit and probit fix it, and how to report average marginal effects and odds ratios.
-
Explainer
The bootstrap explained: standard errors by resampling
How the bootstrap turns one sample into a standard error and a confidence interval, with pairs and cluster versions, failure cases and seeds.
-
Explainer
What is econometrics? A plain-language introduction
Econometrics uses data and statistical methods to measure economic relationships, test theories and evaluate policies. Here is what that means in practice.
-
Explainer
What is regression analysis? A worked example in Python
Regression analysis describes how the average of one variable changes with others. Learn to fit, read and question a linear regression, step by step.
-
Explainer
Correlation vs causation in economics: from confounding to natural experiments
Why a regression coefficient is not automatically a causal effect, and how economists use experiments, instruments and natural experiments to find one.
-
Explainer
What is panel data? Fixed effects, random effects and the Hausman test
Panel data follow the same units over time. Learn why that helps with unobserved differences, and how fixed effects, random effects and the Hausman test work.
-
Explainer
P-values in economics: what they mean and what they do not
A p-value measures how surprising the data would be under a null hypothesis. Learn to read it correctly, avoid common mistakes and report uncertainty well.
-
Guide
How to validate econometric software results, starting with NIST Longley
Check estimator results against certified reference data, measure accuracy in correct digits, and know what a passing test does and does not prove.
-
Guide
Open-source econometrics in Python for Stata, EViews and SPSS users
What an open-source Python workflow for econometrics looks like, which familiar tasks OpenEconometrics covers today and where its limits are.
-
Guide
Reproducible econometrics: from raw data to a table you can rerun
A practical workflow for econometric analyses that others can rerun, with pinned versions, recorded samples, seeds and tables generated from saved results.
-
Guide
Robust and clustered standard errors in Python, from HC0 to the wild bootstrap
How HC0–HC3, cluster-robust and HAC standard errors work, when each is appropriate, and why a handful of clusters calls for the wild cluster bootstrap.
-
Method
Arellano–Bond and system GMM in Python: xtabond and xtabond2
Estimate dynamic panel models in Python with Arellano–Bond difference GMM and Blundell–Bond system GMM, Windmeijer errors and AR(2) and Hansen tests.
-
Method
ARIMA in Python: ARIMA, seasonal ARIMA and ARMAX models
Fit ARIMA, seasonal ARIMA and regression models with ARMA errors in Python by exact maximum likelihood, check the residuals and forecast.
-
Method
Cointegration in Python: ARDL bounds test, Engle–Granger and Johansen
Test for cointegration in Python with Engle–Granger and Johansen tests, and fit ARDL models with the bounds test and error-correction form.
-
Method
Difference-in-differences in Python: didregress and parallel trends
Estimate a two-way fixed-effects difference-in-differences model in Python, cluster by group, test parallel trends and map it to Stata's didregress.
-
Method
Event study regression in Python: leads, lags and pre-trend tests
Fit a two-way fixed-effects event study in Python, choose the leads, lags and reference period, test pre-trends and tabulate the dynamic effects.
-
Method
Fixed effects and random effects regression in Python (xtreg)
Fit fixed-effects, random-effects, between, first-difference and pooled panel regressions in Python with clustered or Driscoll–Kraay standard errors.
-
Method
GARCH models in Python: ARCH, GARCH, GJR and EGARCH
Estimate ARCH, GARCH, GJR and EGARCH volatility models in Python by maximum likelihood, with Student-t errors, residual diagnostics and variance forecasts.
-
Method
Hausman test in Python: fixed or random effects?
Run the Hausman test of fixed against random effects in Python, read what it does and does not show, and use the cluster-robust Mundlak alternative.
-
Method
Heckman selection model in Python: ML and two-step estimation
Correct for sample selection bias in Python with the Heckman model, by maximum likelihood or Heckman's two-step estimator, and test whether rho is zero.
-
Method
Instrumental variables in Python: 2SLS, LIML and GMM
Estimate instrumental-variables regressions in Python with 2SLS, LIML or GMM, read the weak-instrument and overidentification tests, and map them to ivregress.
-
Method
Logit and probit regression in Python with marginal effects
Fit logit and probit models in Python, compute average marginal effects with oe.margins, and map the workflow to Stata's logit, probit and margins.
-
Method
Mixed effects and multilevel models in Python: random intercepts and slopes
Fit linear mixed-effects (multilevel) models in Python by ML or REML, with random intercepts and slopes, nested levels, the ICC and BLUP predictions.
-
Method
Multiple testing correction in Python: Holm, BH and Romano–Wolf
Adjust p-values for multiple hypotheses in Python with Bonferroni, Holm, Benjamini–Hochberg or the Romano–Wolf stepdown, and choose between FWER and FDR.
-
Method
OLS regression in Python with robust and clustered standard errors
Fit OLS and weighted least squares in Python with HC0–HC3, clustered or HAC standard errors, then run tests, linear combinations and margins.
-
Method
Ordered logit, ordered probit and multinomial logit in Python
Fit ordered logit, ordered probit and multinomial logit models in Python, read cutpoints and category probabilities, and map them to ologit and mlogit.
-
Method
Poisson regression, negative binomial and PPML gravity models in Python
Fit Poisson and negative binomial count models and PPML gravity regressions with fixed effects in Python, and map them to poisson, nbreg and ppmlhdfe.
-
Method
Quantile regression in Python: qreg, bootstrap and simultaneous quantiles
Estimate median and other conditional quantiles in Python with qreg, bsqreg and sqreg, and test whether a slope differs across the distribution.
-
Method
reghdfe in Python: regression with high-dimensional fixed effects
Absorb several high-dimensional fixed effects in a linear regression in Python, with singleton removal, exact degrees of freedom and clustered errors.
-
Method
Regression discontinuity in Python: rdrobust with robust bias correction
Estimate sharp and fuzzy regression discontinuity designs in Python with local polynomials, optimal bandwidths and robust bias-corrected intervals.
-
Method
Staggered difference-in-differences in Python: Callaway–Sant'Anna csdid
Estimate Callaway–Sant'Anna group-time ATTs for staggered adoption in Python, aggregate them by event time and see why a two-way fixed-effects DiD can mislead.
-
Method
SUR regression and three-stage least squares in Python
Estimate seemingly unrelated regressions and simultaneous-equation systems by three-stage least squares in Python, with cross-equation tests and constraints.
-
Method
Survival analysis in Python: Cox proportional hazards, stcox and streg
Fit Cox proportional hazards and Weibull or other parametric survival models in Python, test proportional hazards, and map them to Stata's stcox and streg.
-
Method
Synthetic control in Python: donor weights, placebos and synthetic DiD
Estimate a synthetic control for one treated unit in Python, read its donor weights and placebo p-value, and compare it with synthetic DiD.
-
Method
Tobit model and truncated regression in Python
Estimate Tobit models for censored outcomes and truncated regressions in Python, compute their marginal effects, and map them to Stata's tobit and truncreg.
-
Method
Treatment effects in Python: propensity score matching, IPW and AIPW
Estimate ATE and ATET in Python by regression adjustment, inverse probability weighting, doubly robust AIPW or matching, and map each to Stata's teffects.
-
Method
Unit root tests in Python: ADF, KPSS, Phillips–Perron and DF-GLS
Run augmented Dickey–Fuller, Phillips–Perron, DF-GLS, KPSS and Zivot–Andrews tests in Python and read their statistics, critical values and p-values.
-
Method
VAR and vector error correction models (VECM) in Python
Fit vector autoregressions and Johansen error-correction models in Python, with lag selection, Granger causality tests, impulse responses and forecasts.
-
Method
Wild cluster bootstrap in Python: a boottest workflow for few clusters
Run restricted wild cluster bootstrap tests and confidence sets in Python when there are few clusters, the workflow of the boottest command in Stata.
-
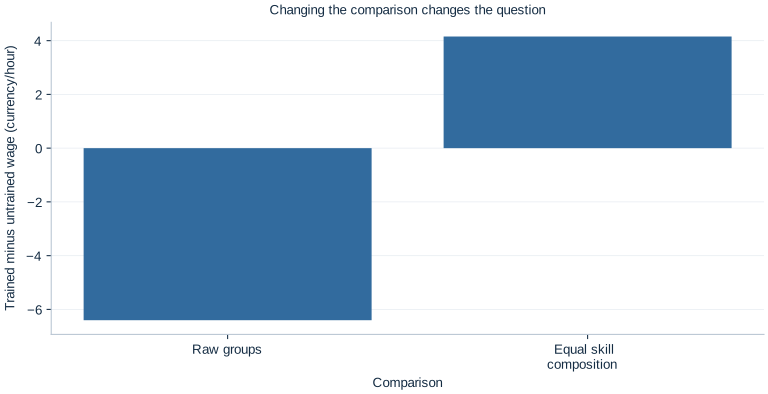
Econometrics lab 01
The Economic Question Comes First
Research questions, observational units, data types and study design.
-
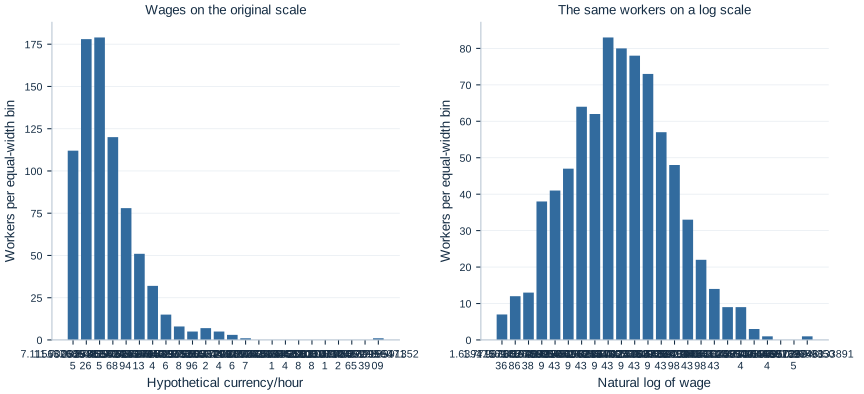
Econometrics lab 02
A First Look at Wages
Descriptive statistics, distributions and clear exploratory plots.
-
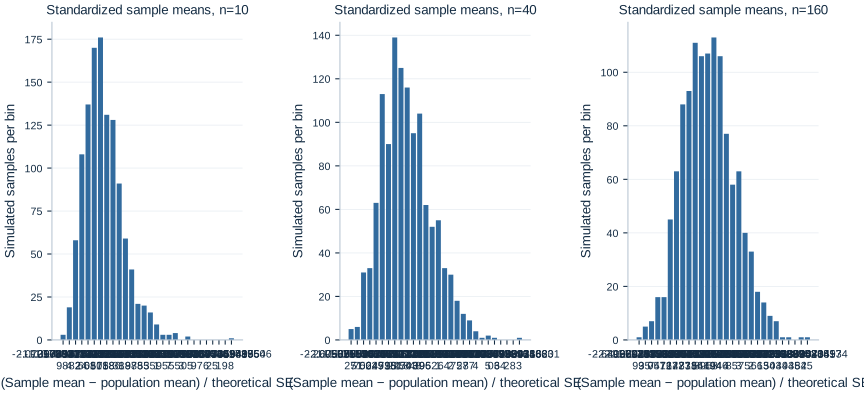
Econometrics lab 03
What Changes Across Random Samples?
Sampling variation, standard errors and the central limit theorem.
-
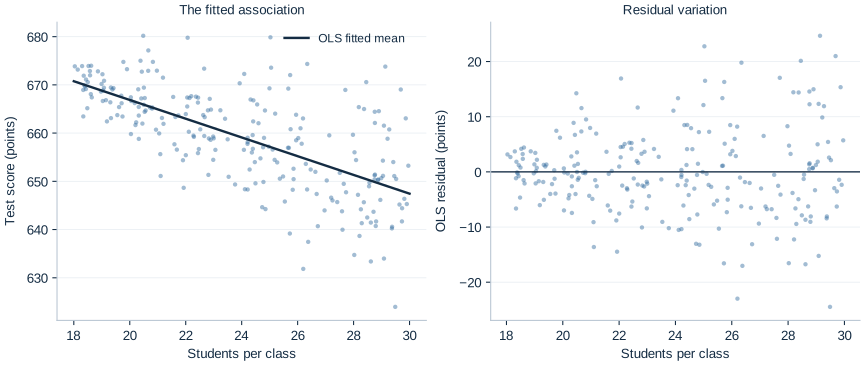
Econometrics lab 04
Does Class Size Predict Test Scores?
Simple OLS with robust inference.
-
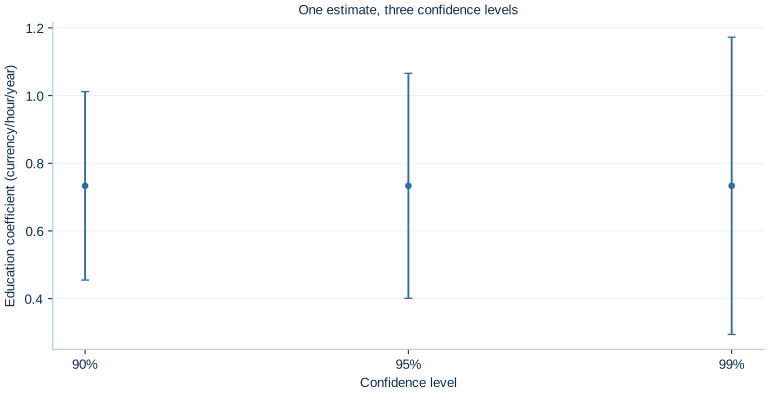
Econometrics lab 05
How Precise Is Our Estimate?
Confidence intervals, t tests and the difference between precision and importance.
-
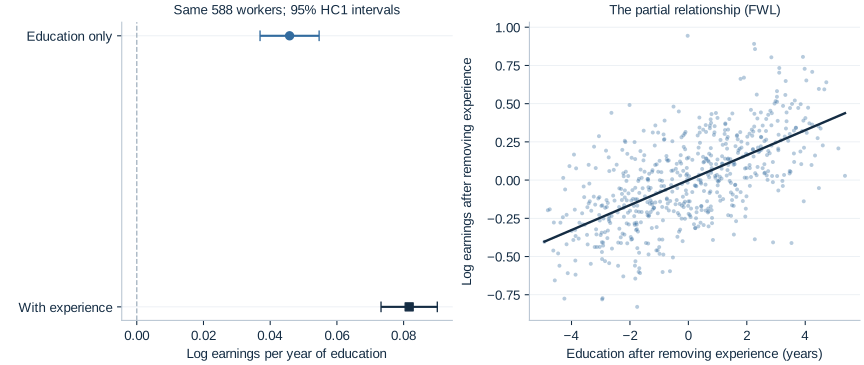
Econometrics lab 06
What Changes When We Add Controls?
Multiple regression, omitted variable bias and same-sample comparisons.
-
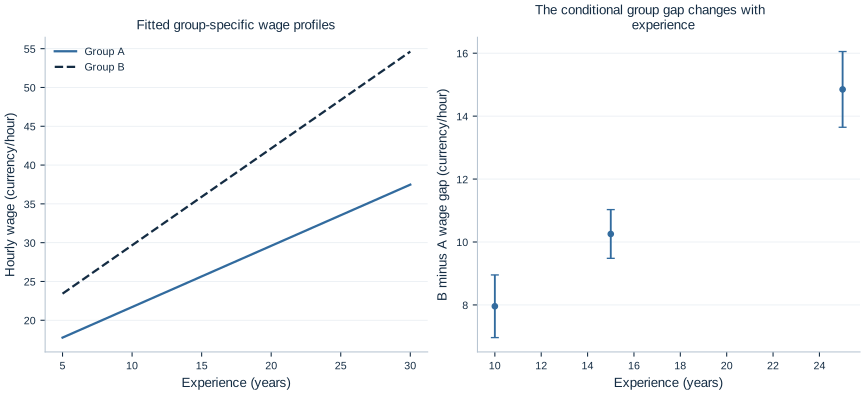
Econometrics lab 07
Do Groups Have Different Wage Profiles?
Indicator variables, interactions and conditional comparisons.
-
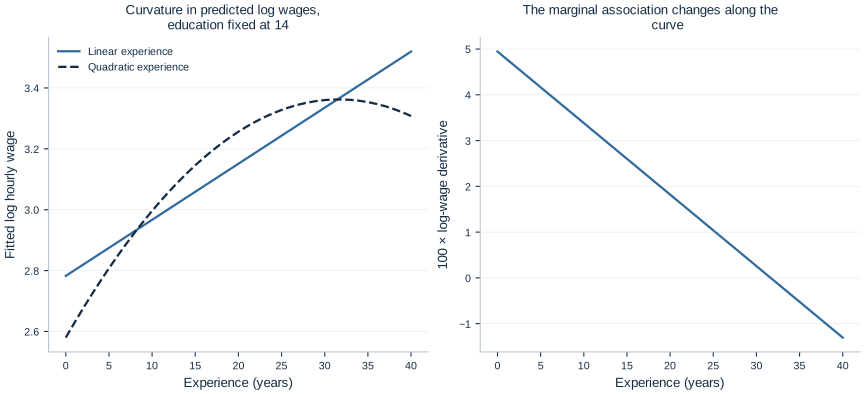
Econometrics lab 08
Modeling Percentage Changes and Curvature
Log transformations, polynomial terms and interpretation.
-
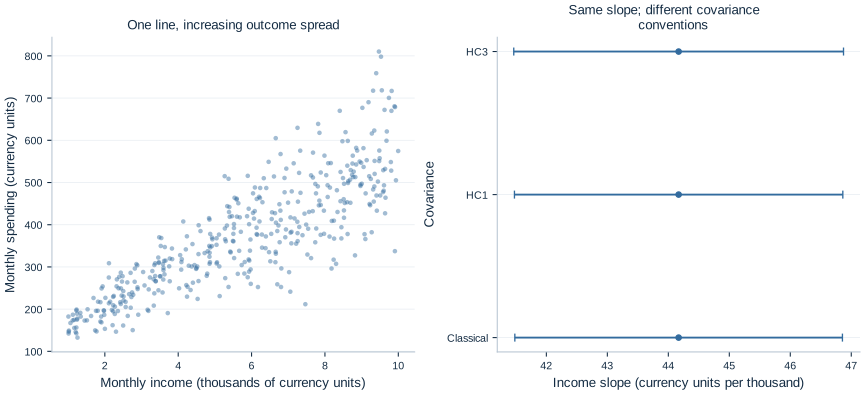
Econometrics lab 09
Same Coefficient, Different Standard Error?
Heteroskedasticity and robust covariance estimation.
-
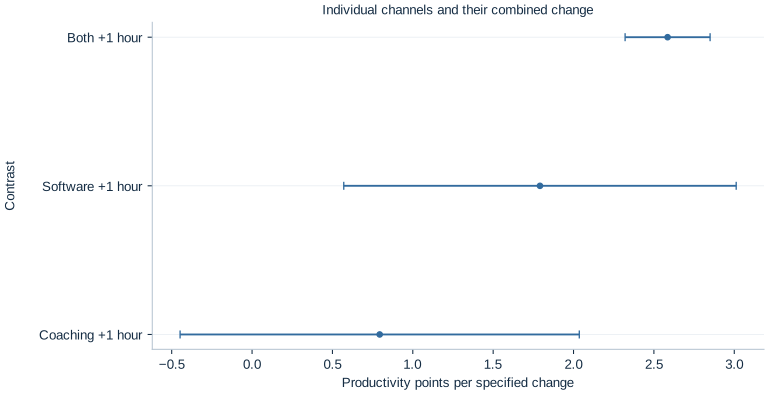
Econometrics lab 10
Testing Several Claims Together
Joint restrictions, F/Wald tests and specification questions.
-
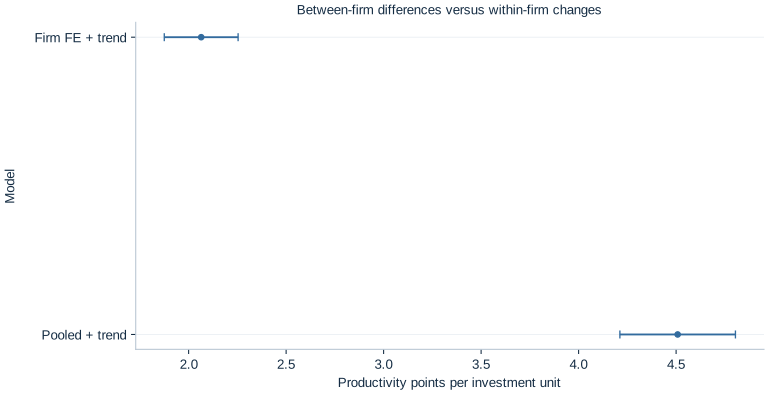
Econometrics lab 11
Comparing Firms to Themselves
Panel data, fixed effects and cluster-robust uncertainty.
-
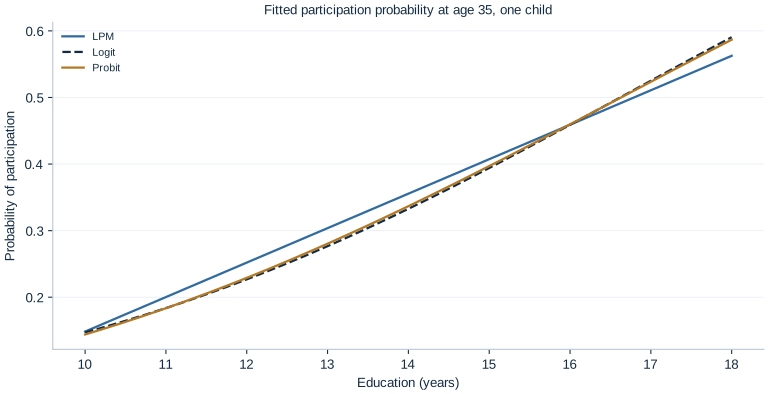
Econometrics lab 12
Explaining Labor-Force Participation
Linear probability, logit/probit models and marginal effects.
-
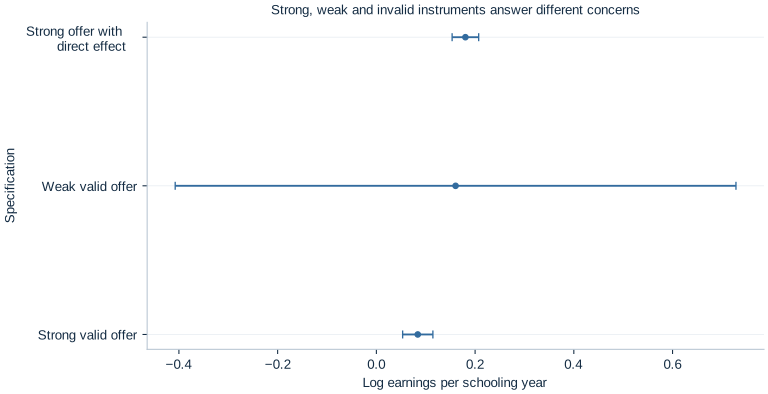
Econometrics lab 13
Estimating Effects with an Instrument
IV/2SLS, relevance, exclusion and weak-instrument limitations.
-
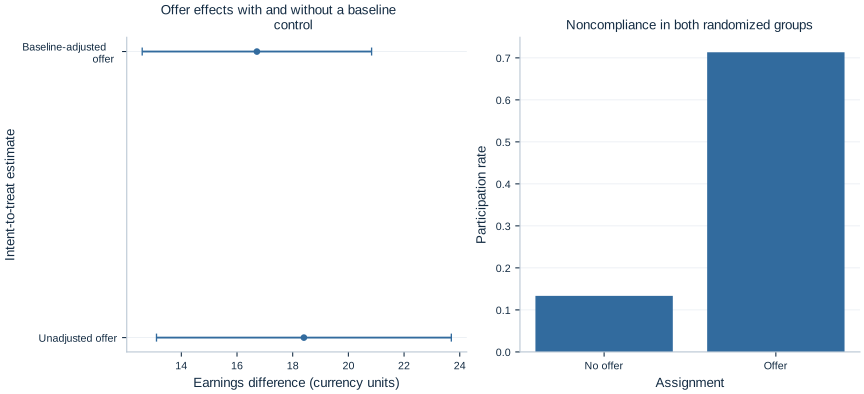
Econometrics lab 14
Evaluating a Randomized Training Program
Random assignment, treatment contrasts and uncertainty.
-
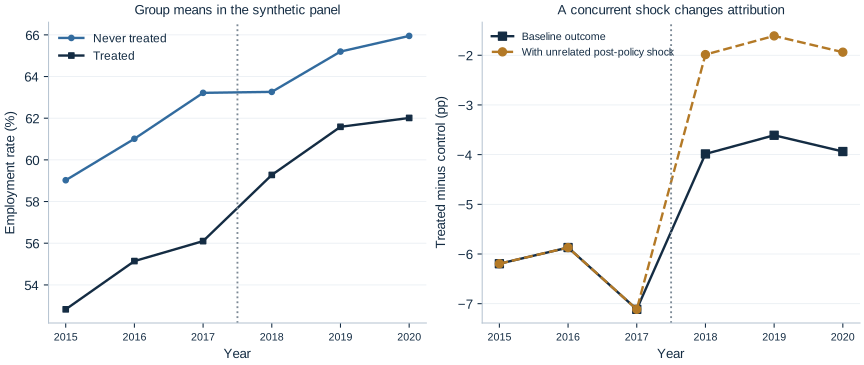
Econometrics lab 15
Before and After a Policy Reform
Difference-in-Differences, parallel trends and treatment-unit clustering.
-
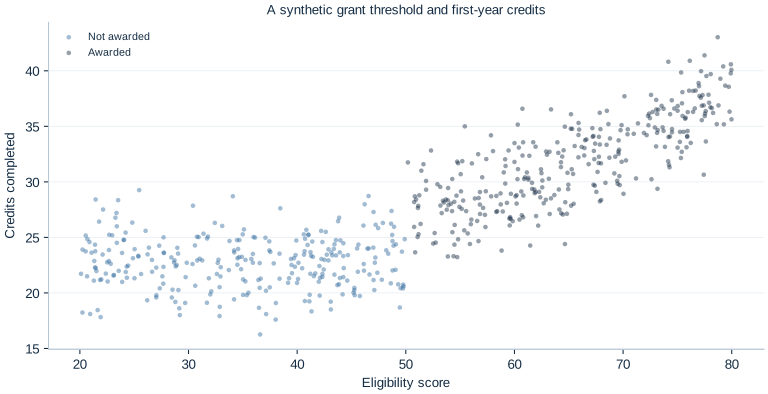
Econometrics lab 16
What Happens Around an Eligibility Cutoff?
Regression discontinuity, bandwidths, continuity and local effects.
-
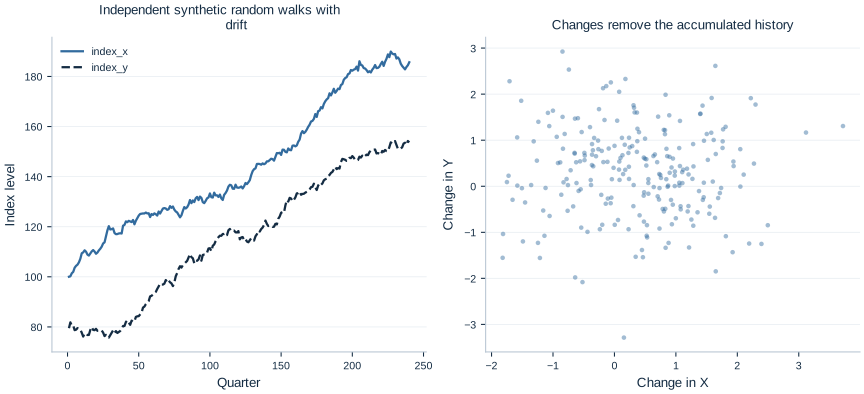
Econometrics lab 17
The Trap of Trending Series
Stationarity, unit roots and spurious regression.
-
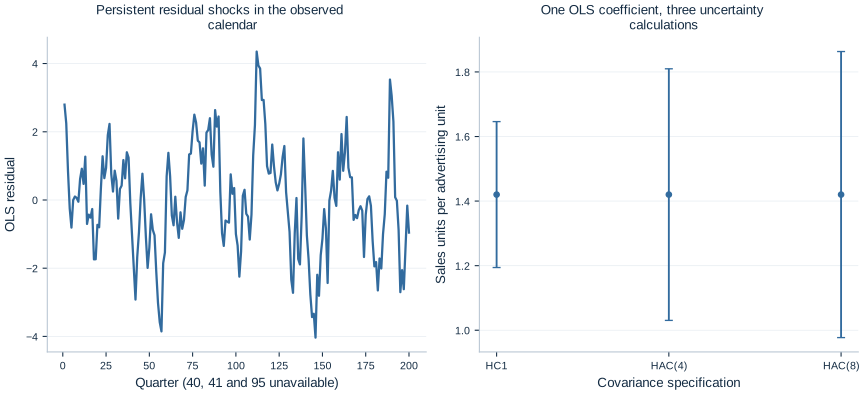
Econometrics lab 18
Accounting for Persistent Shocks
Serial correlation and HAC inference.
-
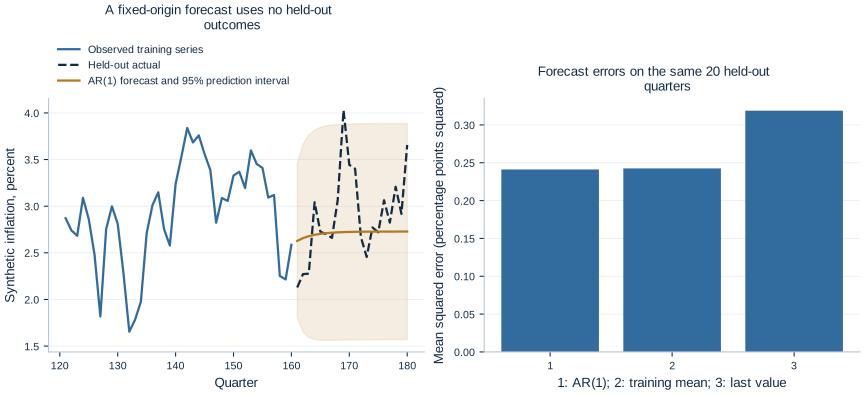
Econometrics lab 19
Forecasting Inflation Without Looking Ahead
Autoregressive models, time-ordered evaluation and forecast errors.
-
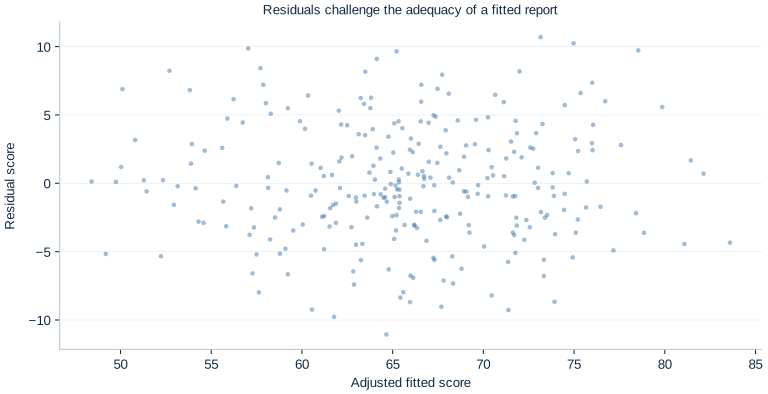
Econometrics lab 20
From Research Question to Finished Report
Capstone: design, data, estimation, diagnostics and reproducible reporting.
-
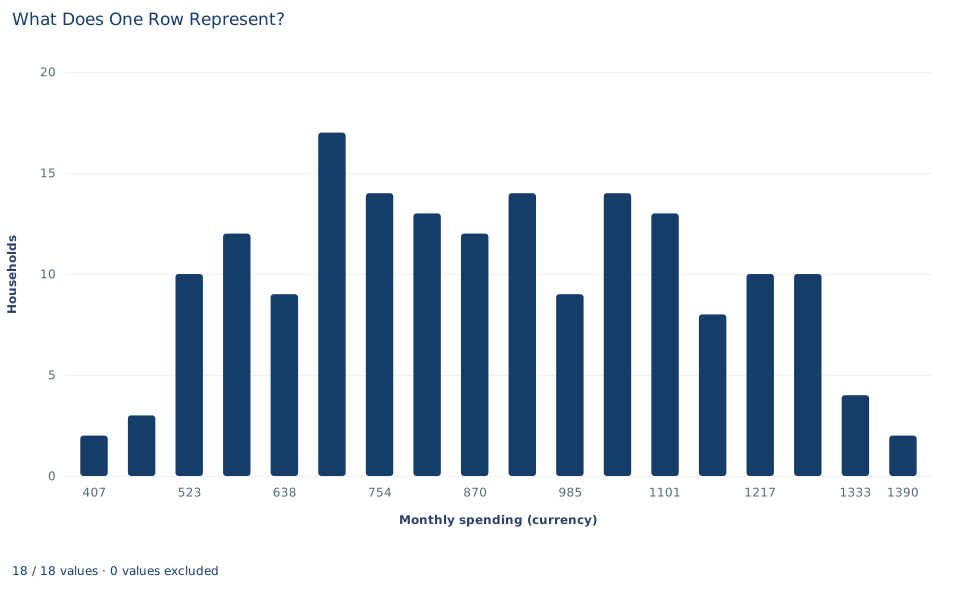
Statistics lab 01
What Does One Row Represent?
Observational units, measurement scales and missing values.
-
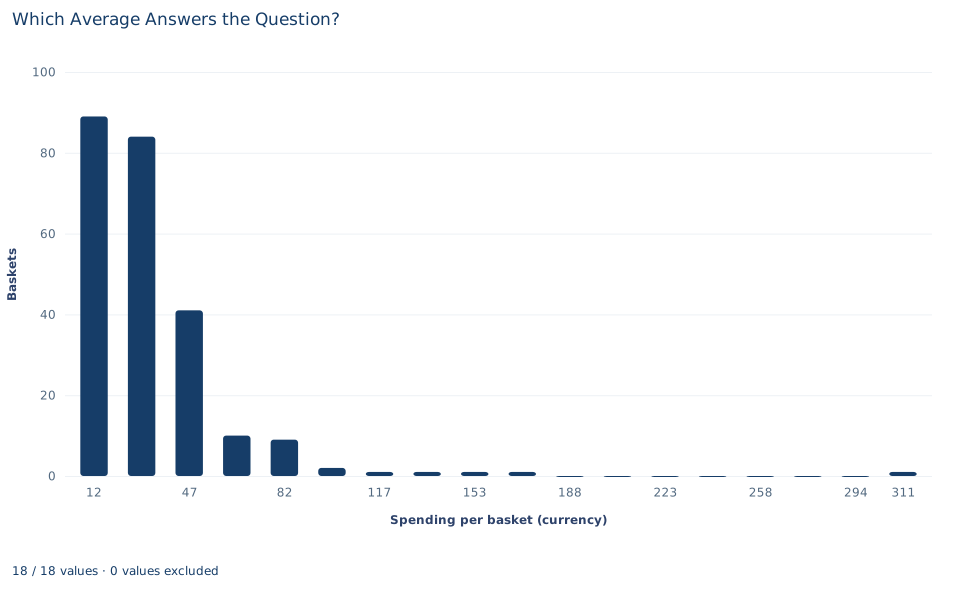
Statistics lab 02
Which Average Answers the Question?
Mean, median, geometric mean and the influence of a tail.
-
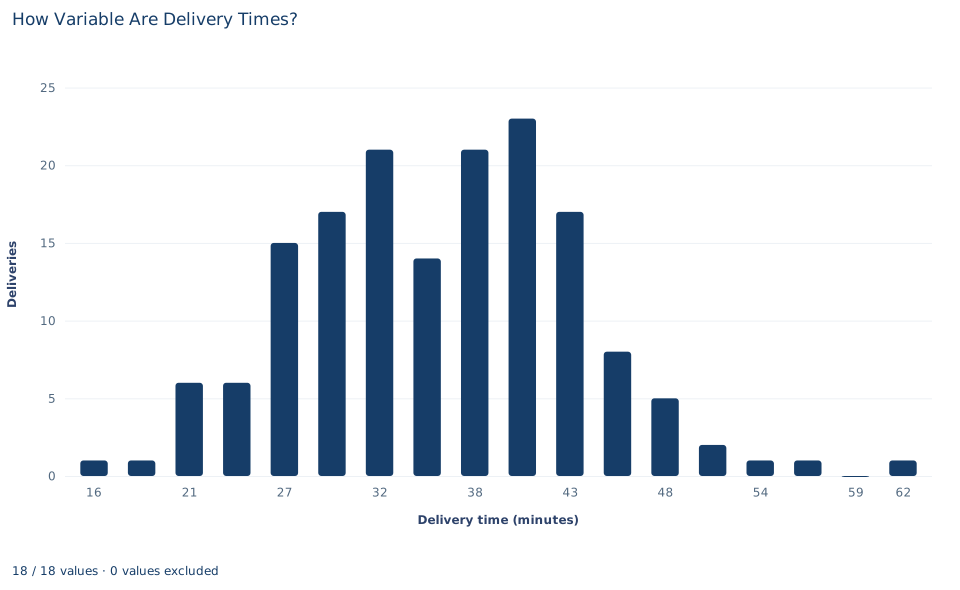
Statistics lab 03
How Variable Are Delivery Times?
Sample variance, standard deviation, IQR and rescaling.
-
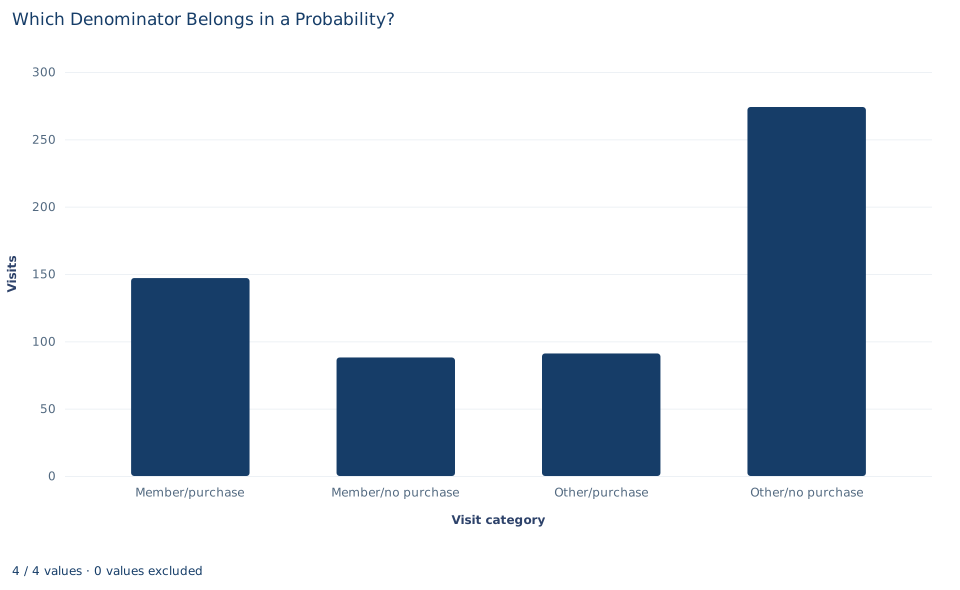
Statistics lab 04
Which Denominator Belongs in a Probability?
Joint, marginal and conditional event frequencies.
-
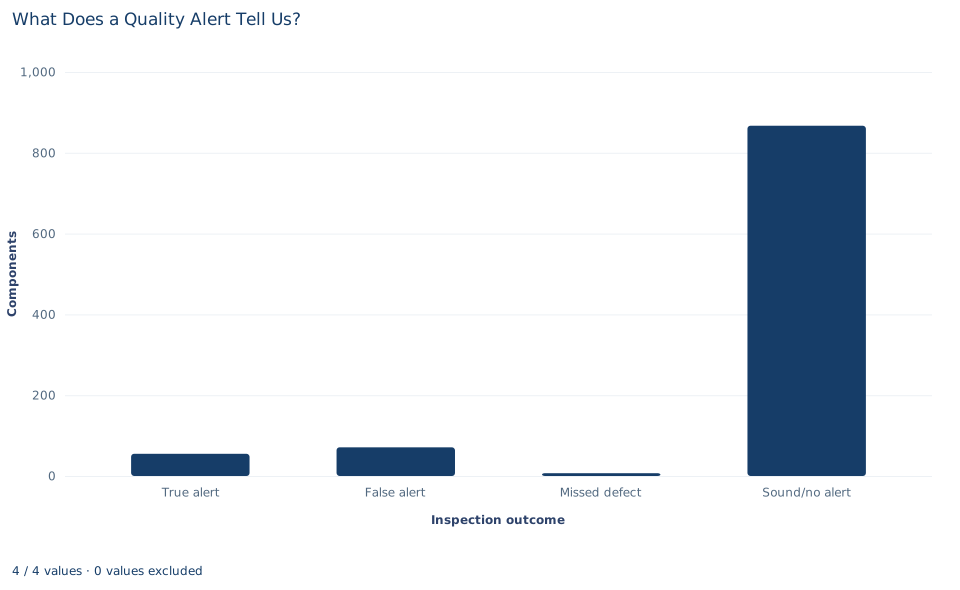
Statistics lab 05
What Does a Quality Alert Tell Us?
Bayes theorem, sensitivity, specificity and base rates.
-
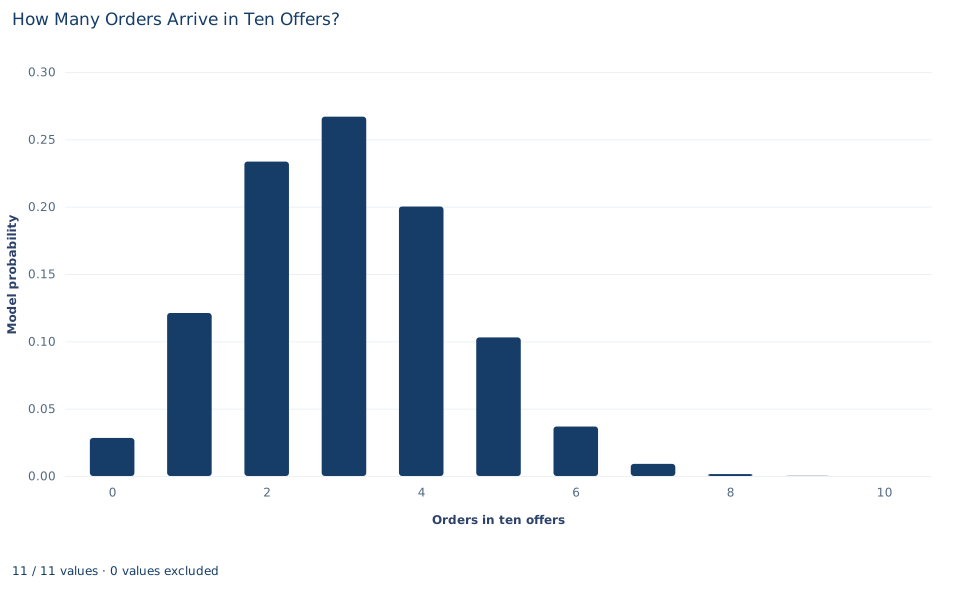
Statistics lab 06
How Many Orders Arrive in Ten Offers?
Binomial probabilities, expectation and variance.
-
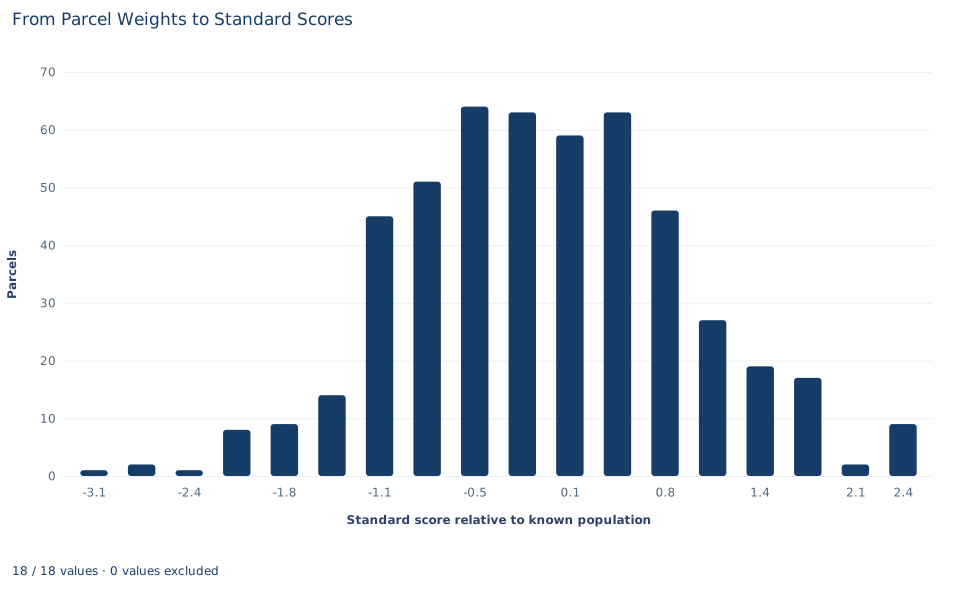
Statistics lab 07
From Parcel Weights to Standard Scores
Normal models, standardization and model versus observed tails.
-
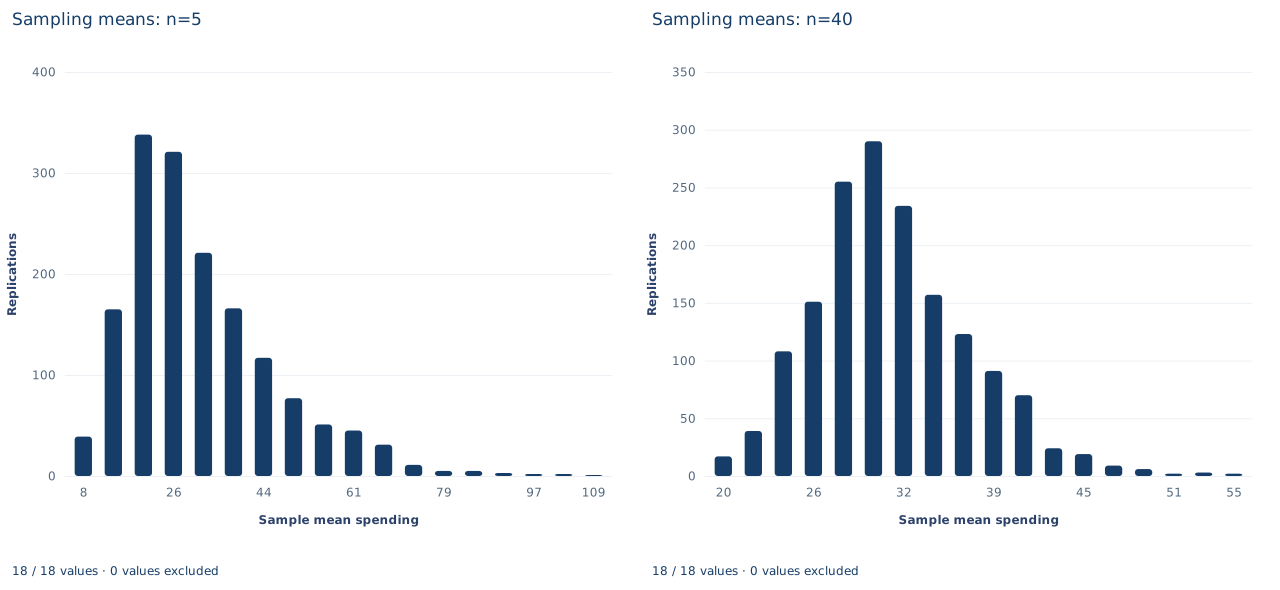
Statistics lab 08
Why Do Averages Vary Less Than Observations?
Repeated sampling, standard errors and the CLT.
-
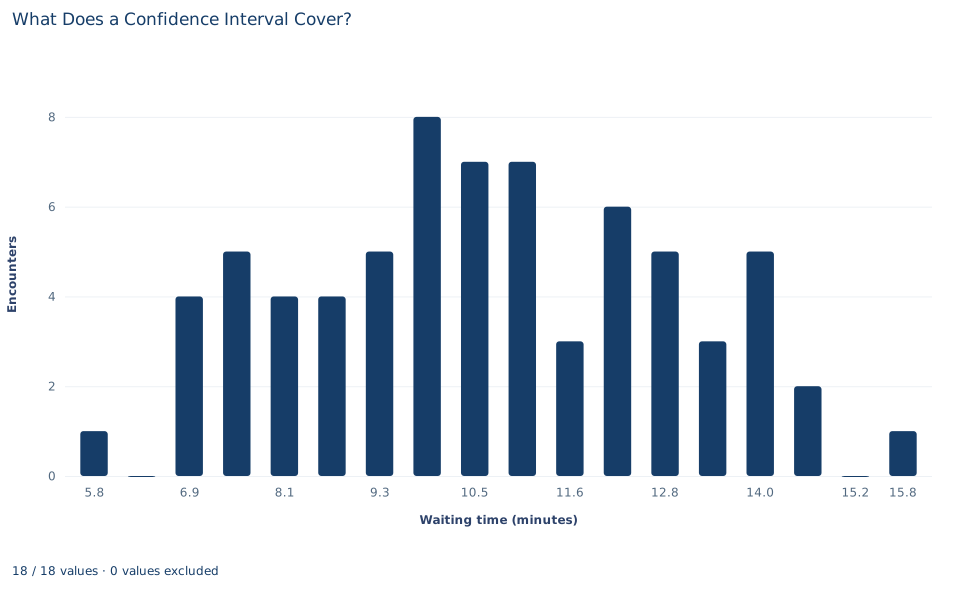
Statistics lab 09
What Does a Confidence Interval Cover?
Student-t intervals, coverage and interval width.
-
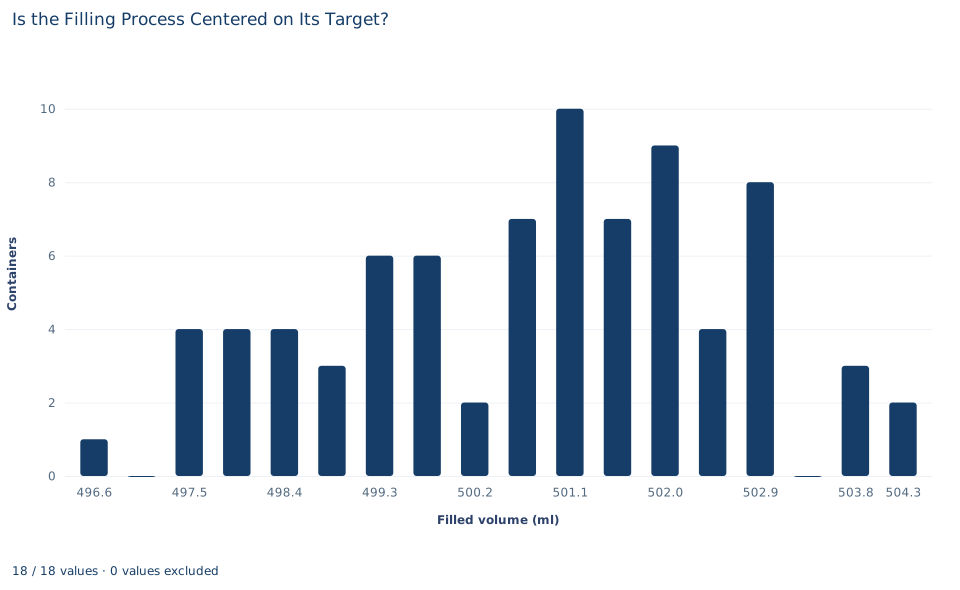
Statistics lab 10
Is the Filling Process Centered on Its Target?
Null hypotheses, t statistics, p values and practical importance.
-
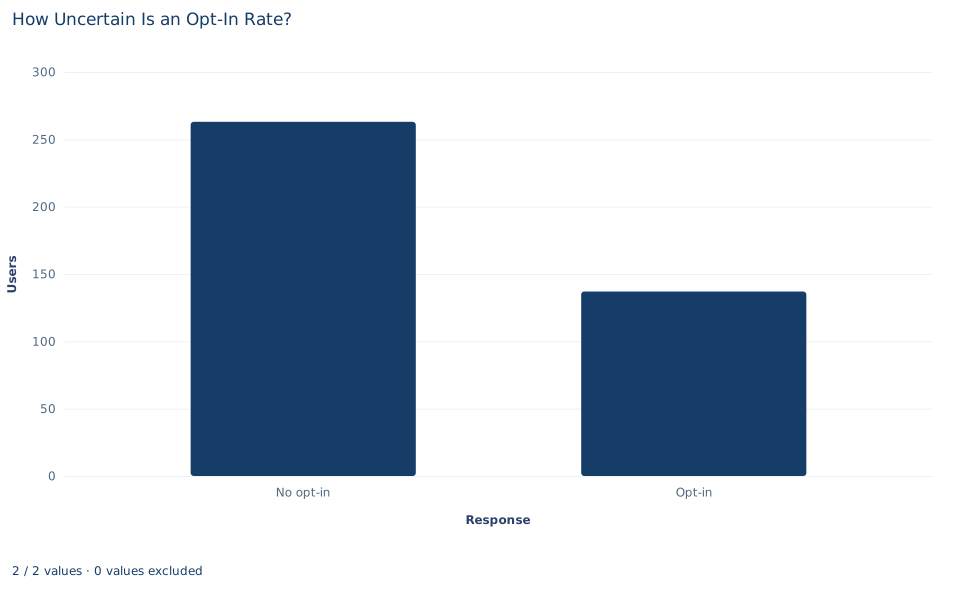
Statistics lab 11
How Uncertain Is an Opt-In Rate?
Proportion z tests, Wald and Wilson intervals.
-
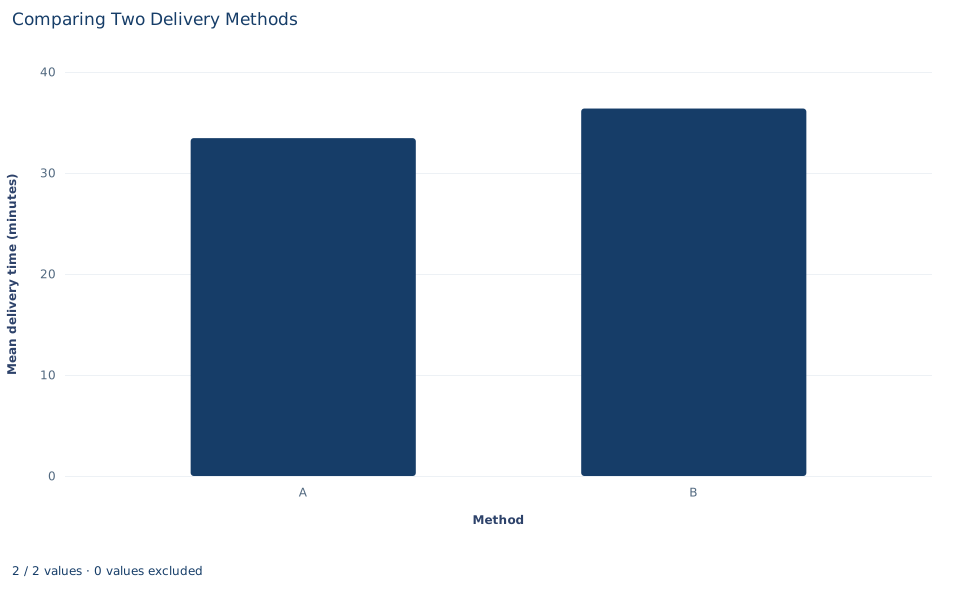
Statistics lab 12
Comparing Two Delivery Methods
Independent samples, Welch uncertainty and group order.
-
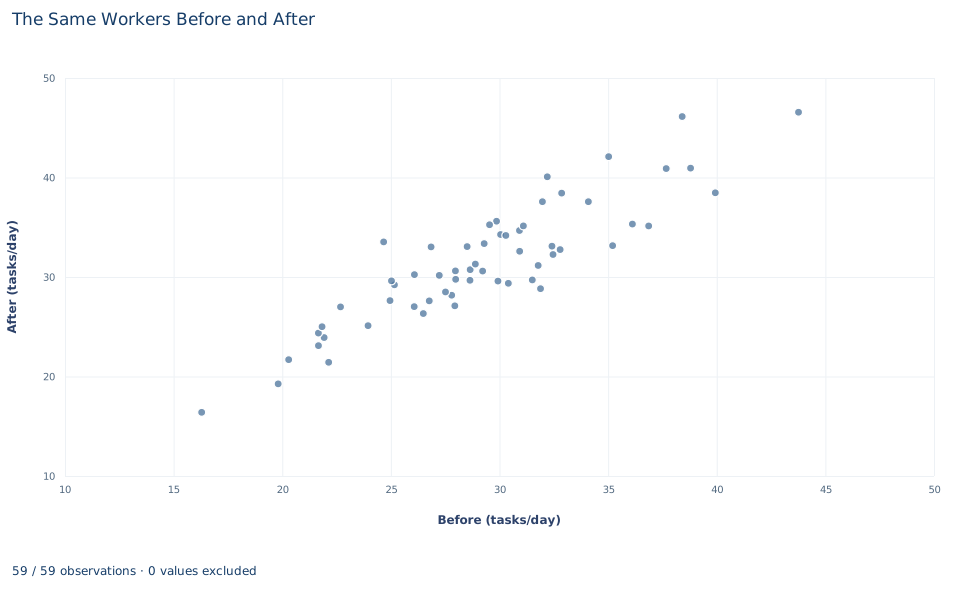
Statistics lab 13
The Same Workers Before and After
Pairing, complete pairs and the variance of differences.
-
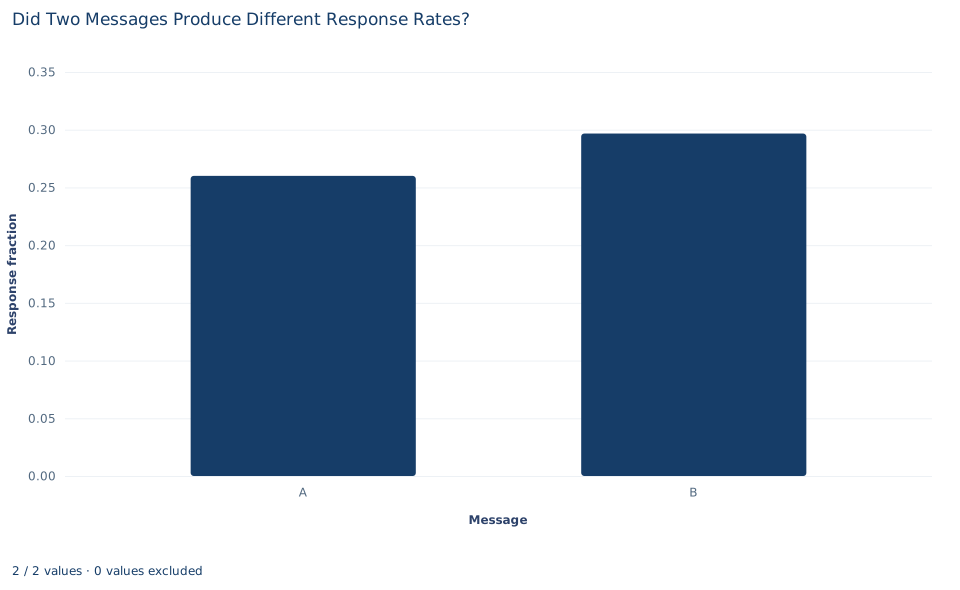
Statistics lab 14
Did Two Messages Produce Different Response Rates?
Pooled null tests, unpooled intervals and percentage points.
-
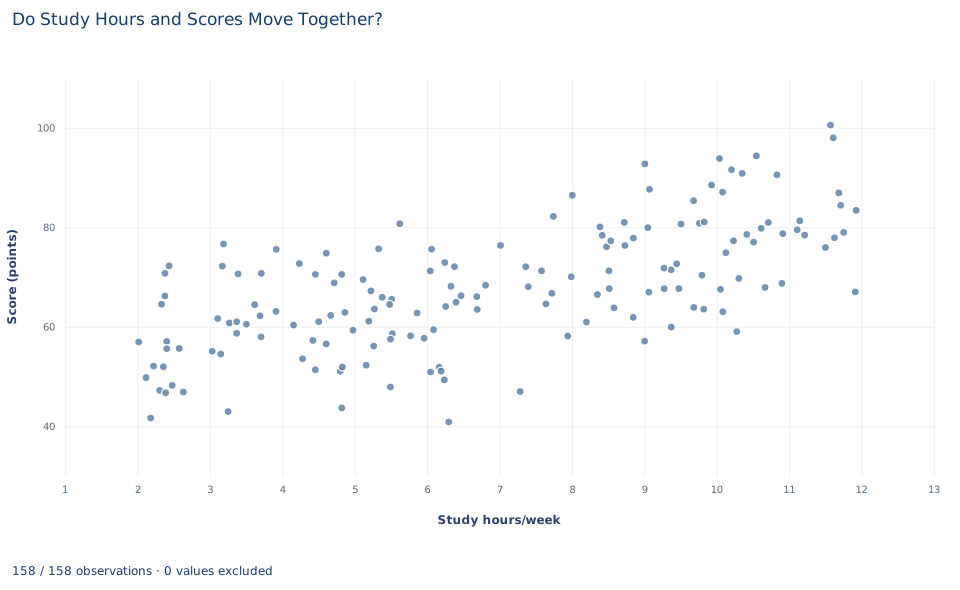
Statistics lab 15
Do Study Hours and Scores Move Together?
Pearson correlation, common samples and noncausal association.
-
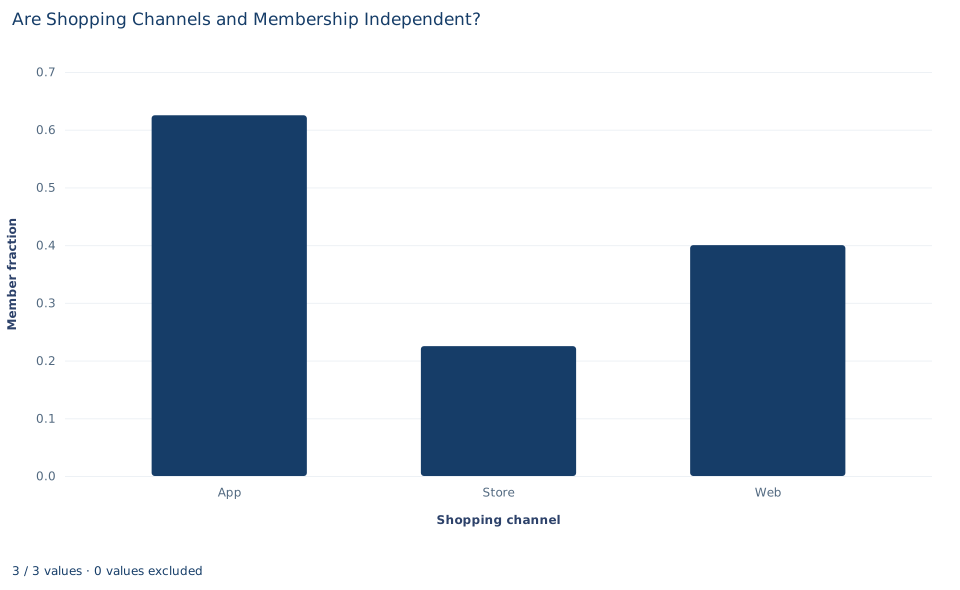
Statistics lab 16
Are Shopping Channels and Membership Independent?
Expected counts, Pearson chi-square and association size.
-
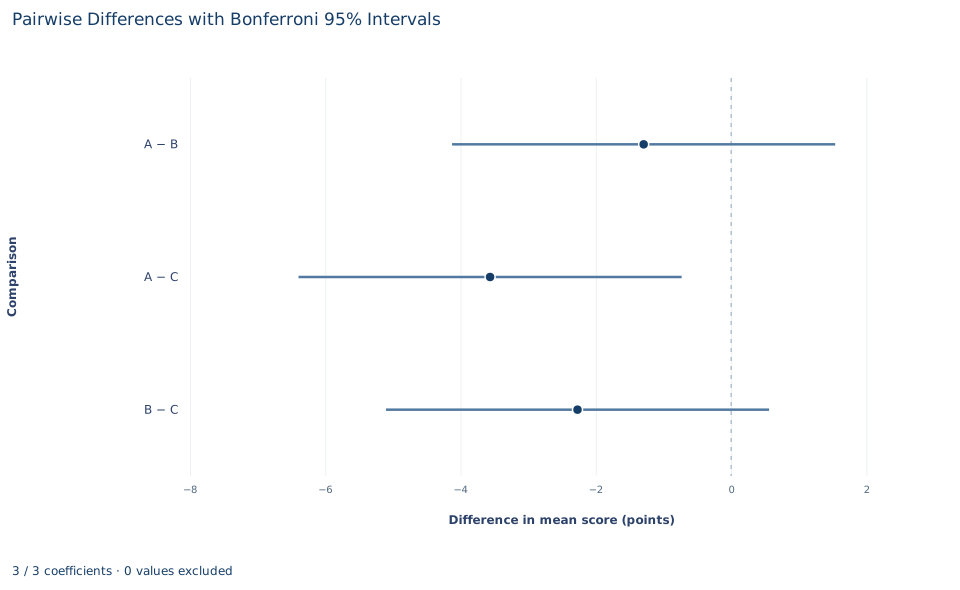
Statistics lab 17
Comparing Three Training Formats
Between/within variation, ANOVA F and adjusted comparisons.
-
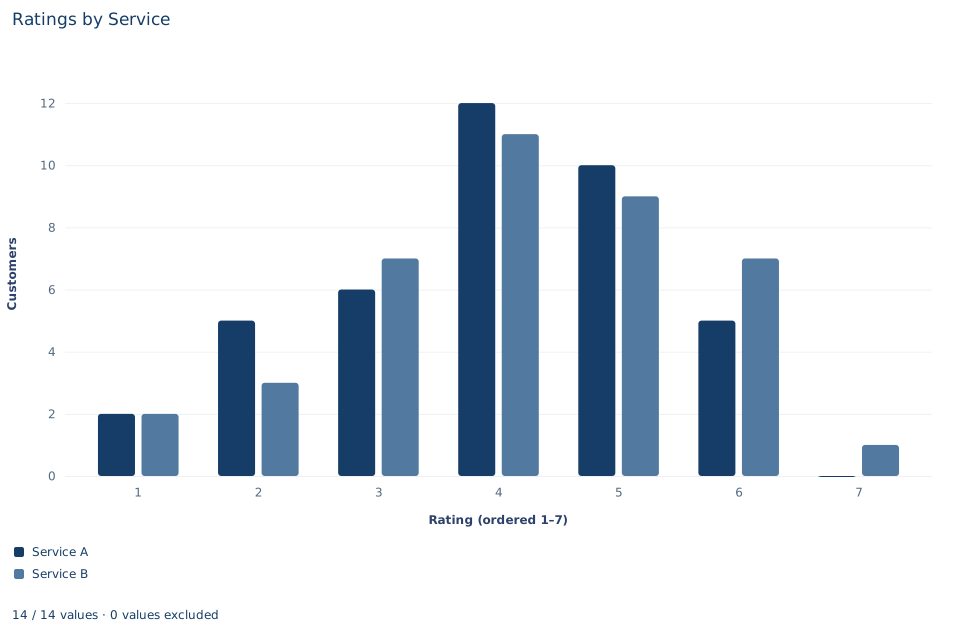
Statistics lab 18
Comparing Ordinal Customer Ratings
Midranks, ties, rank-sum tests and probability of superiority.
-
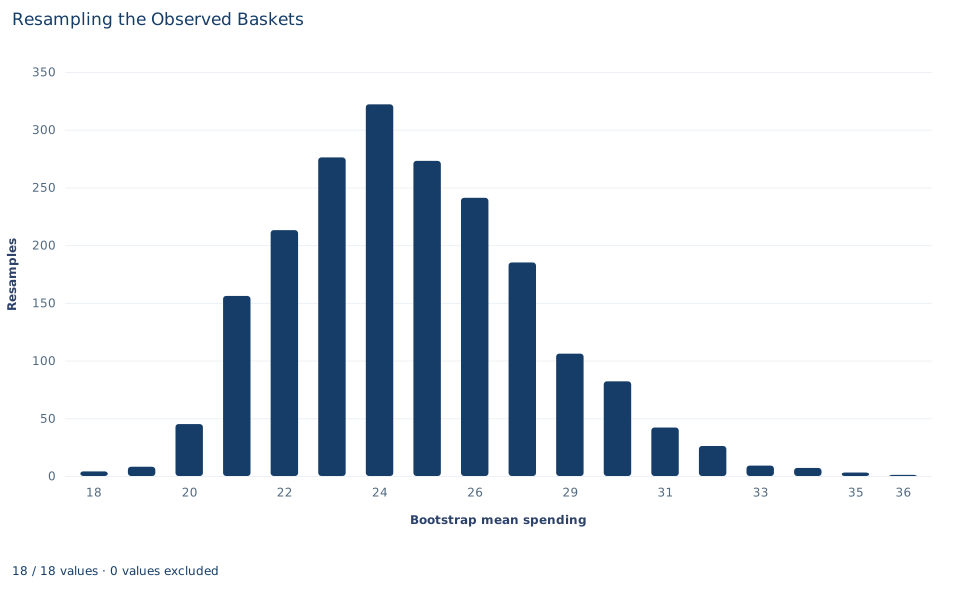
Statistics lab 19
Resampling the Observed Baskets
Nonparametric bootstrap, Monte Carlo error and percentile intervals.
-
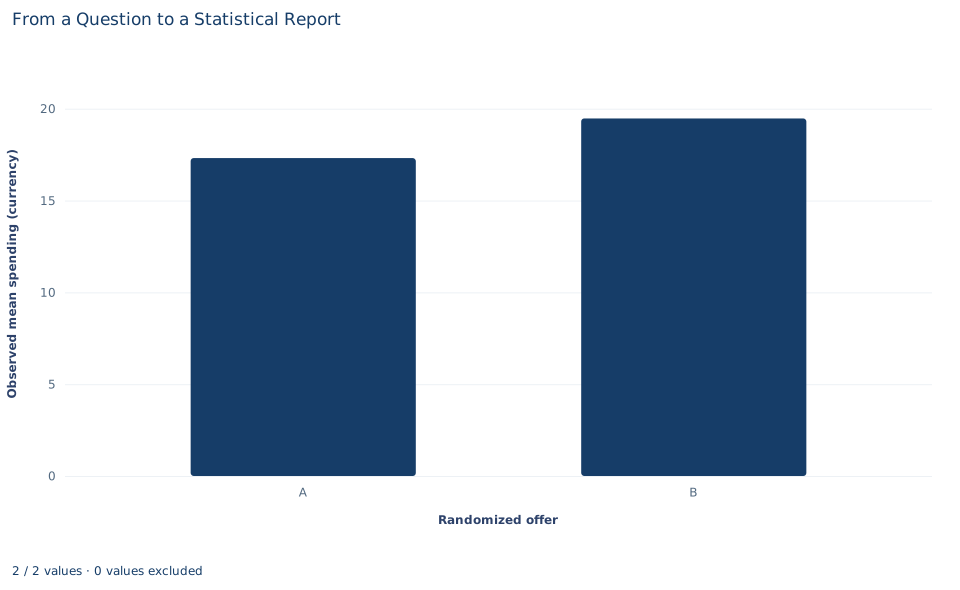
Statistics lab 20
From a Question to a Statistical Report
Primary outcomes, missingness, uncertainty and multiple testing.
-
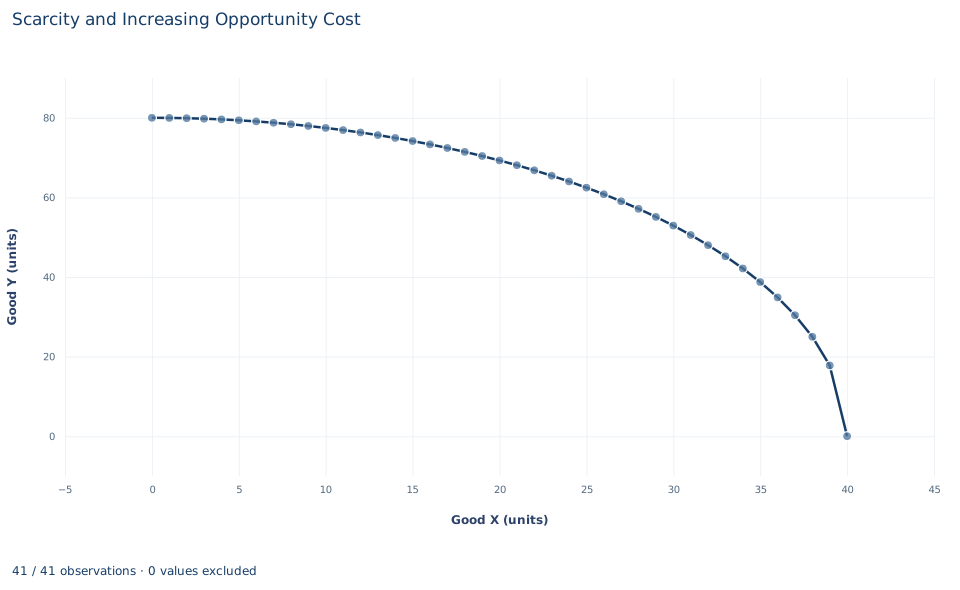
Microeconomics lab 01
Scarcity and Increasing Opportunity Cost
Why does producing more of X require an increasing sacrifice of Y?
-
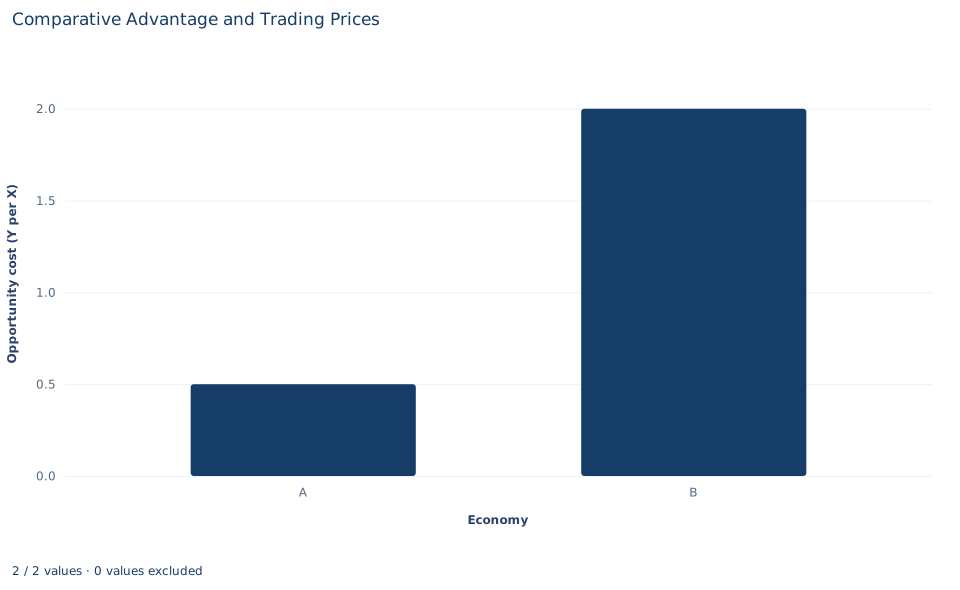
Microeconomics lab 02
Comparative Advantage and Trading Prices
Can both economies gain from trade even when productivity comparisons differ by good?
-
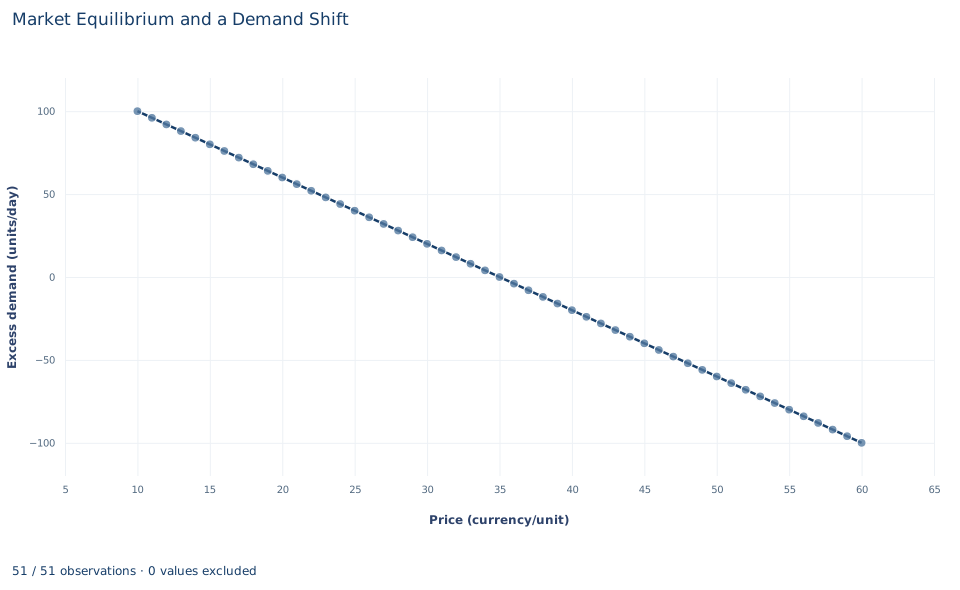
Microeconomics lab 03
Market Equilibrium and a Demand Shift
How does a demand shift differ from moving along a demand curve?
-
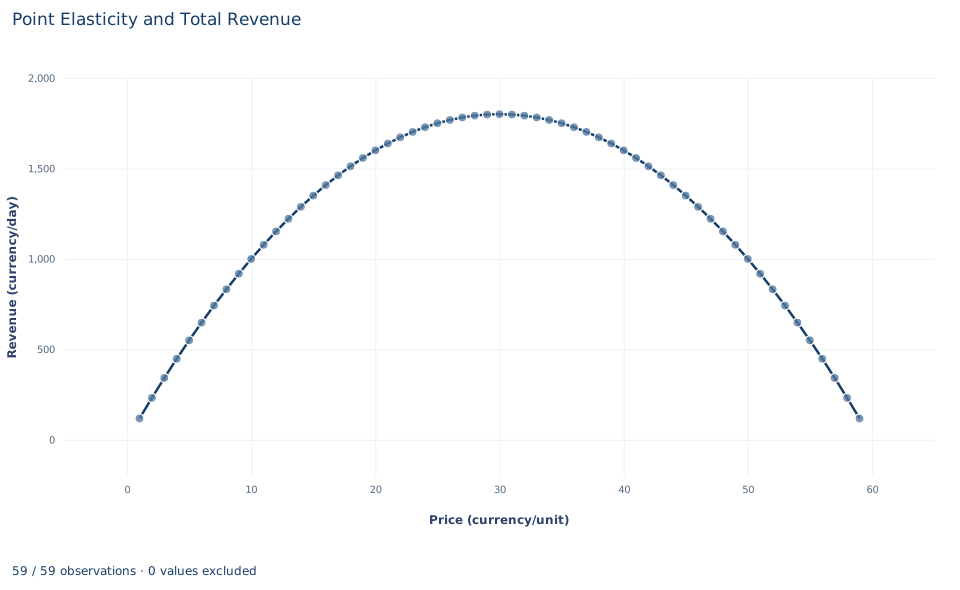
Microeconomics lab 04
Point Elasticity and Total Revenue
When does raising price increase revenue?
-
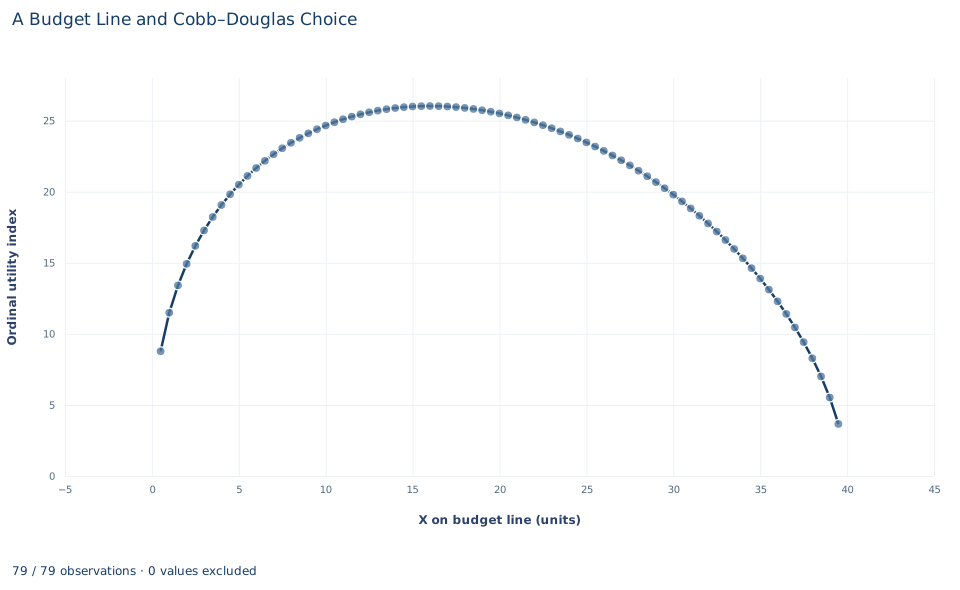
Microeconomics lab 05
A Budget Line and Cobb–Douglas Choice
How do preferences and a budget determine a consumption bundle?
-
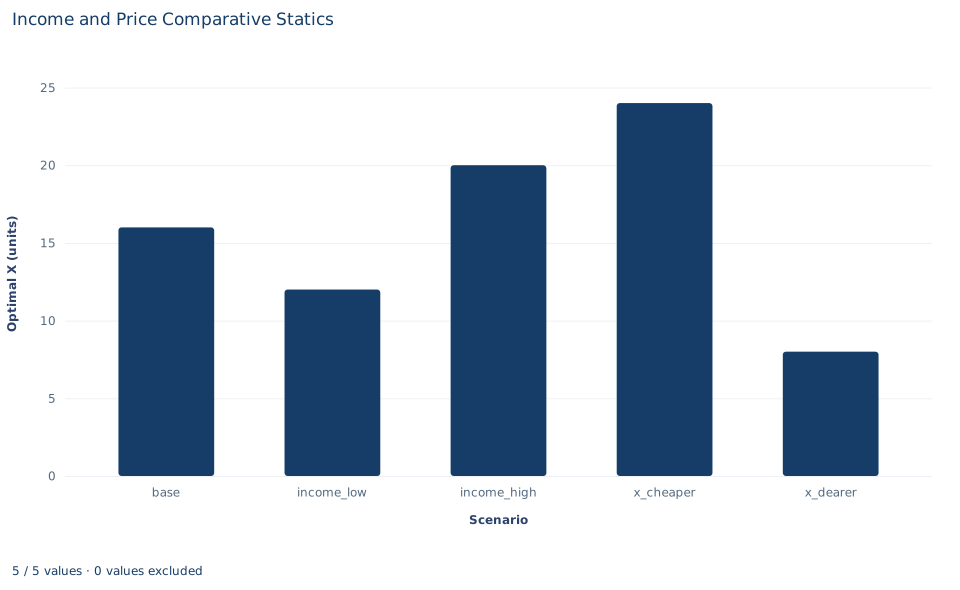
Microeconomics lab 06
Income and Price Comparative Statics
What changes when income rises, and what changes when only one price rises?
-
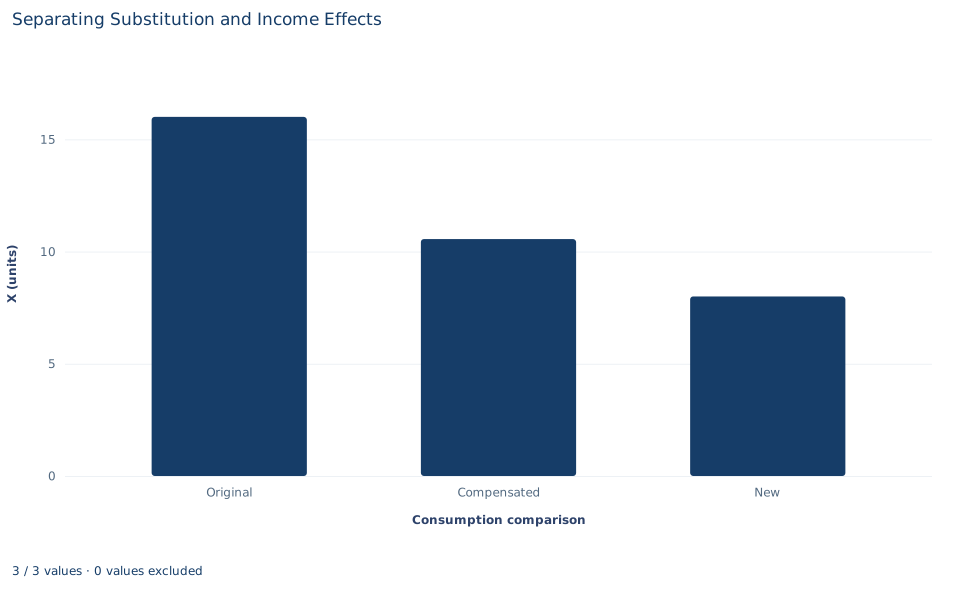
Microeconomics lab 07
Separating Substitution and Income Effects
How much of a price response reflects substitution rather than lost purchasing power?
-
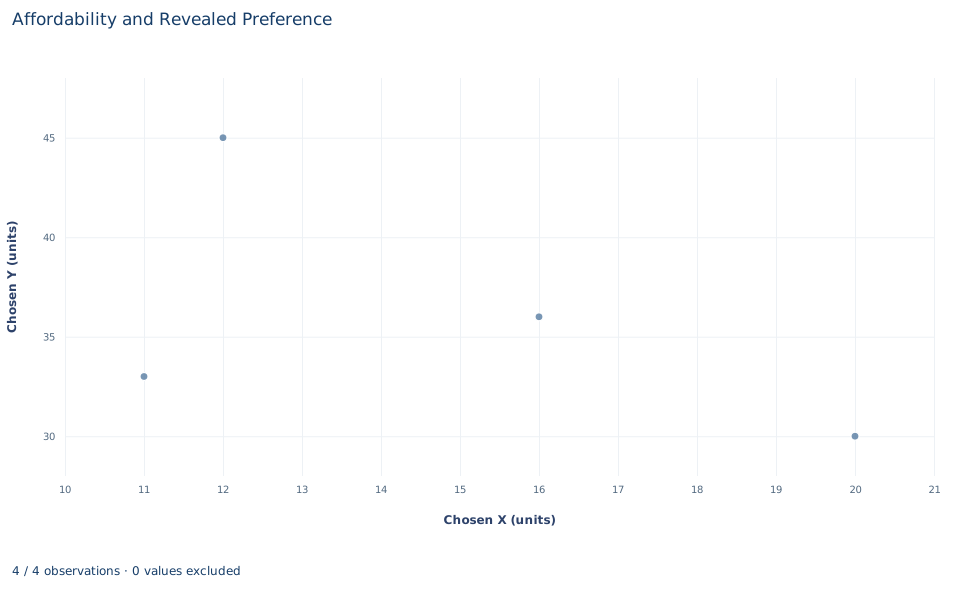
Microeconomics lab 08
Affordability and Revealed Preference
What can observed choices reveal when another bundle was affordable?
-
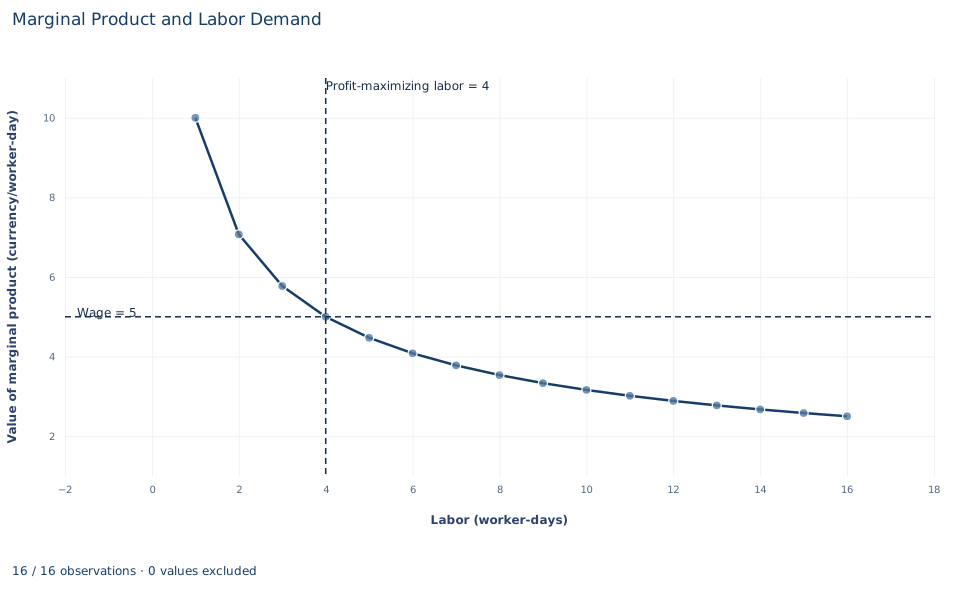
Microeconomics lab 09
Marginal Product and Labor Demand
When should a firm stop adding labor to a fixed technology?
-
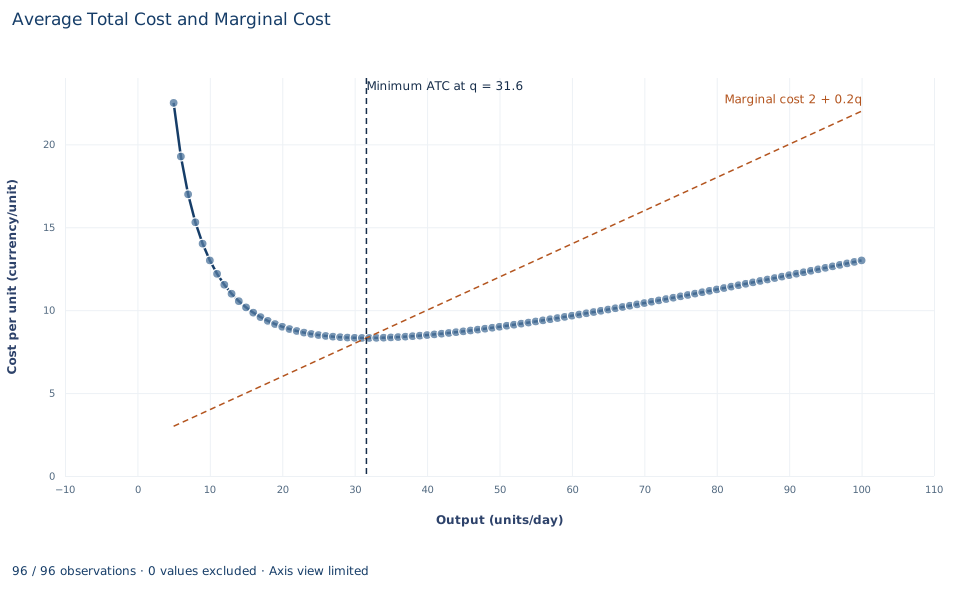
Microeconomics lab 10
Total, Average and Marginal Cost
Why does marginal cost cross average cost at its minimum?
-
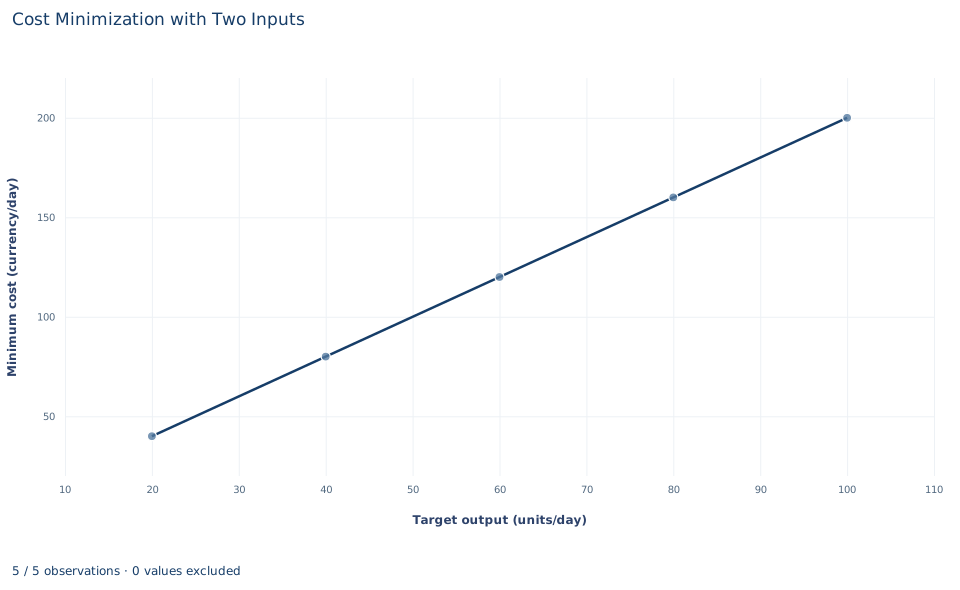
Microeconomics lab 11
Cost Minimization with Two Inputs
How can a firm produce a fixed output at minimum cost?
-
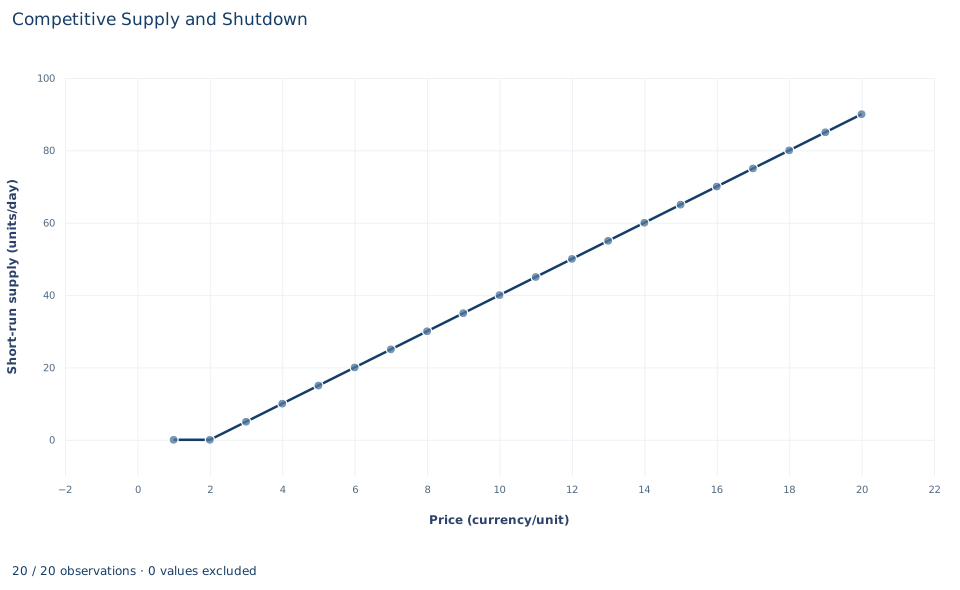
Microeconomics lab 12
Competitive Supply and Shutdown
Why might a firm produce while making a loss?
-
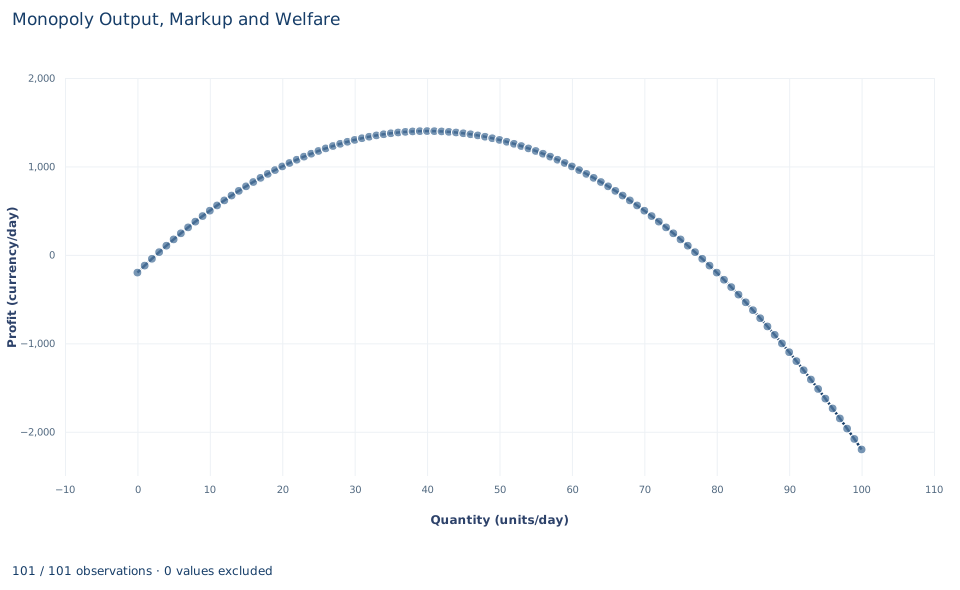
Microeconomics lab 13
Monopoly Output, Markup and Welfare
Why does a monopolist restrict output relative to a competitive benchmark?
-
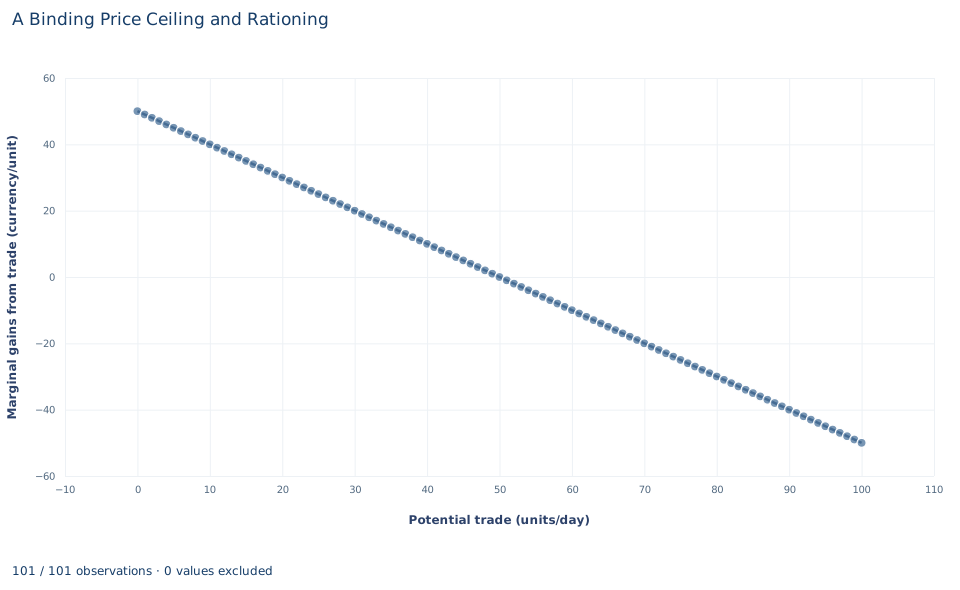
Microeconomics lab 14
A Binding Price Ceiling and Rationing
How can a lower legal price reduce total gains from trade?
-
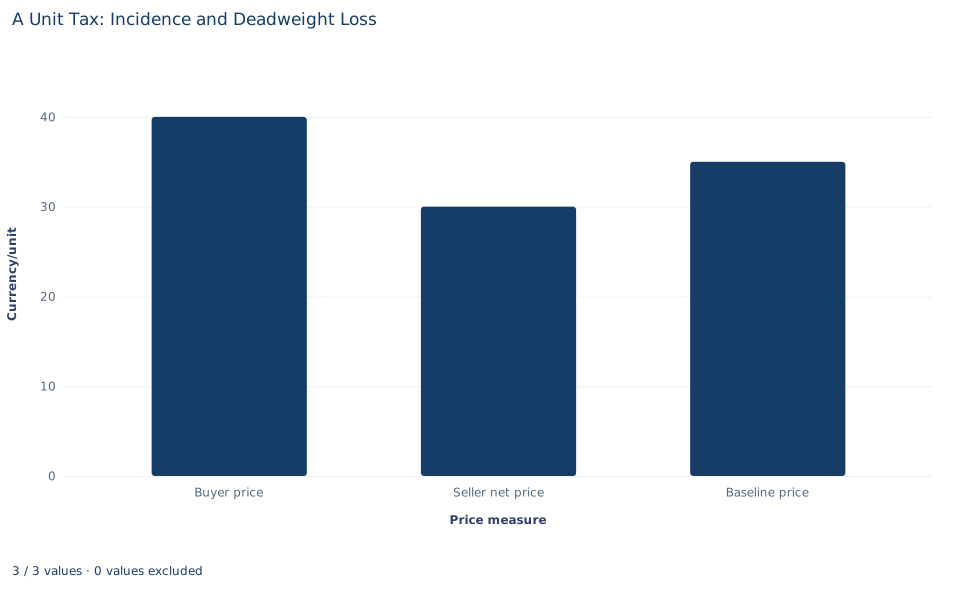
Microeconomics lab 15
A Unit Tax: Incidence and Deadweight Loss
Who bears a tax when the legal remitter is the seller?
-
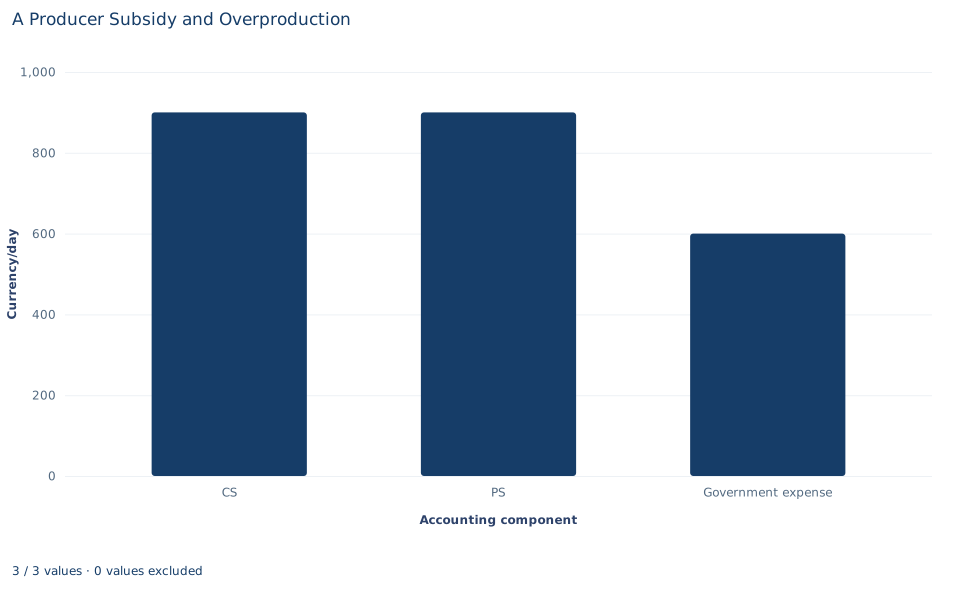
Microeconomics lab 16
A Producer Subsidy and Overproduction
Can buyers and sellers both gain while total surplus falls?
-
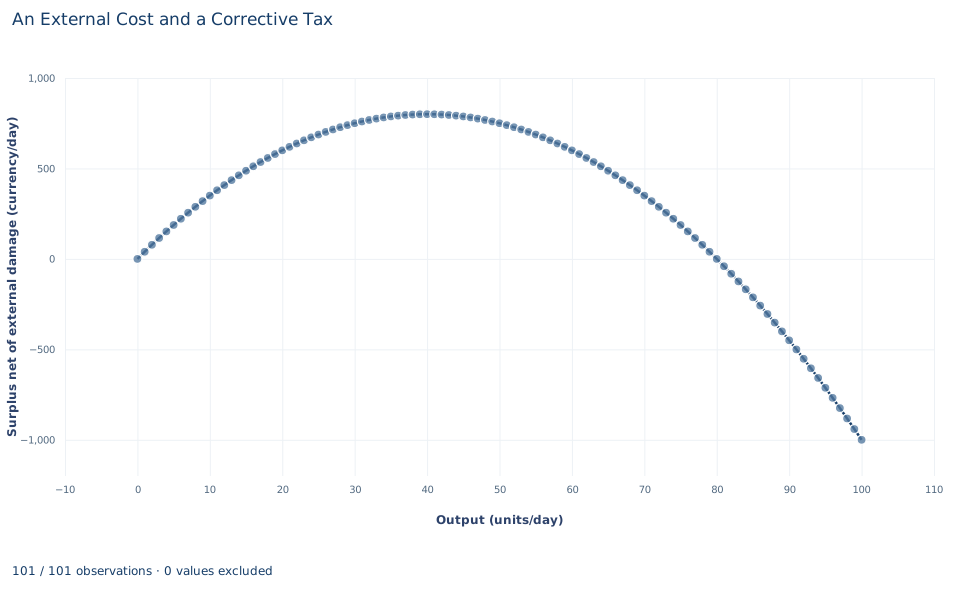
Microeconomics lab 17
An External Cost and a Corrective Tax
How does an unpriced external cost change efficient output?
-
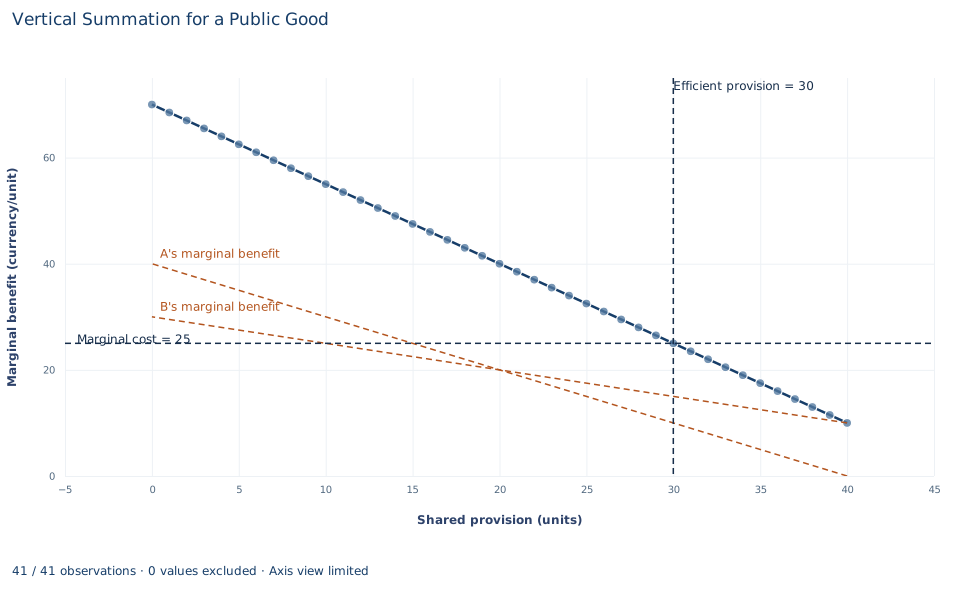
Microeconomics lab 18
Vertical Summation for a Public Good
Why are public-good marginal benefits added vertically?
-
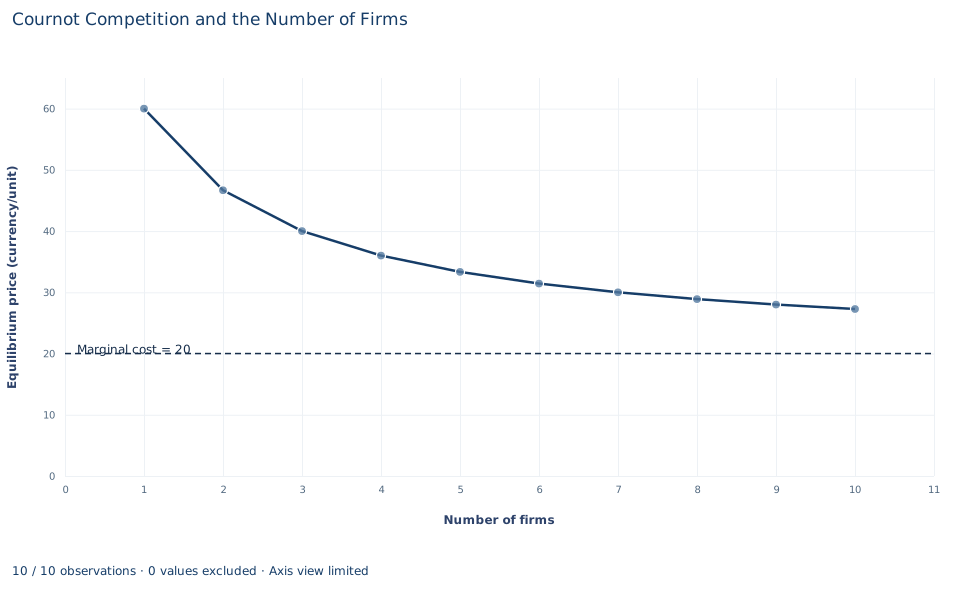
Microeconomics lab 19
Cournot Competition and the Number of Firms
How does strategic quantity competition change with the number of firms?
-
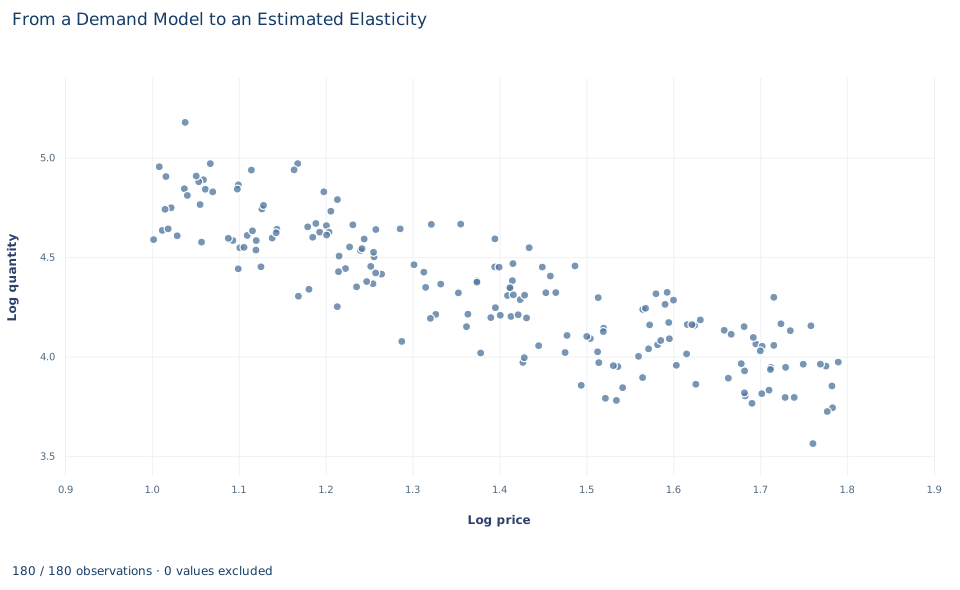
Microeconomics lab 20
From a Demand Model to an Estimated Elasticity
How can a log-demand coefficient be interpreted without confusing identification and fit?
-
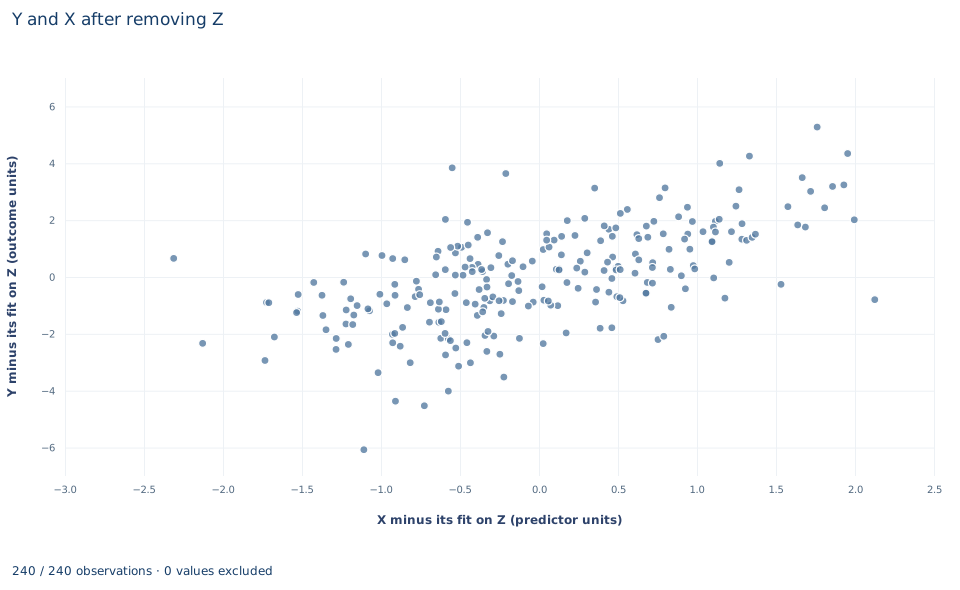
Advanced Econometrics lab 01
The Frisch–Waugh–Lovell Identity
Why can residualizing both outcome and exposure recover a controlled regression slope?
-
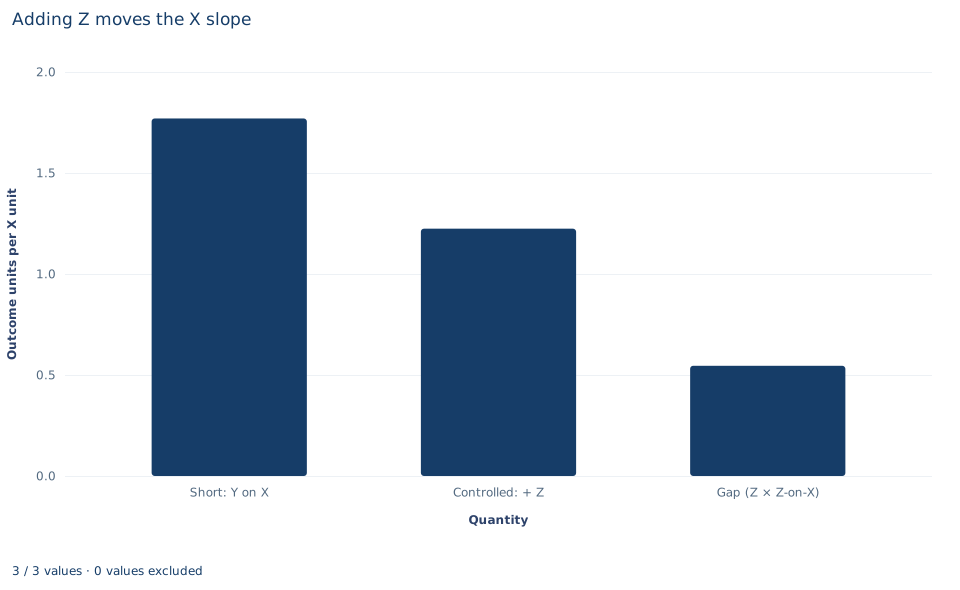
Advanced Econometrics lab 02
An Exact Sample Omitted-Variable Decomposition
How does omitting a correlated control change a regression coefficient?
-
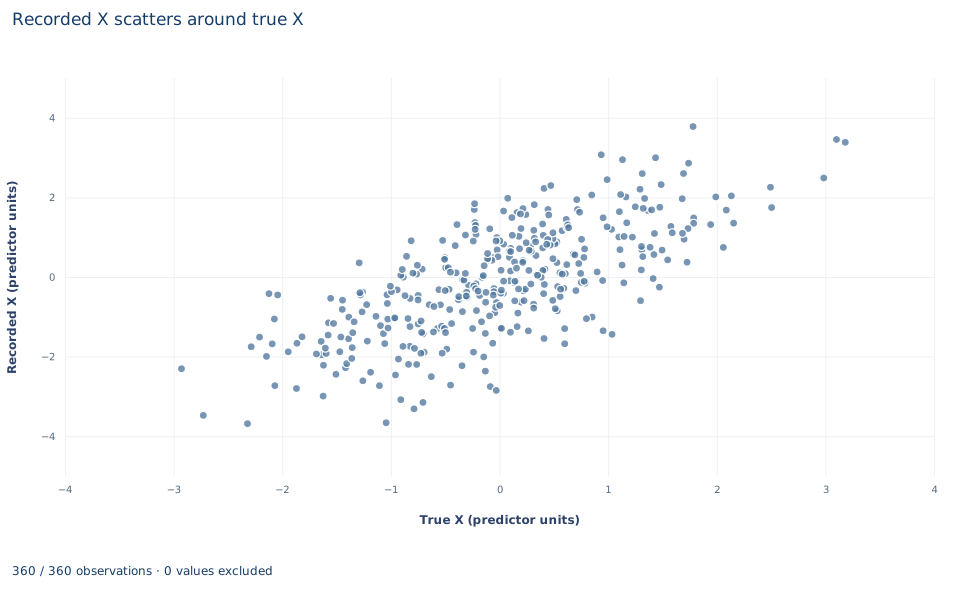
Advanced Econometrics lab 03
Measurement Error and Attenuation
Why can noisy exposure measurement shrink an ordinary regression slope?
-
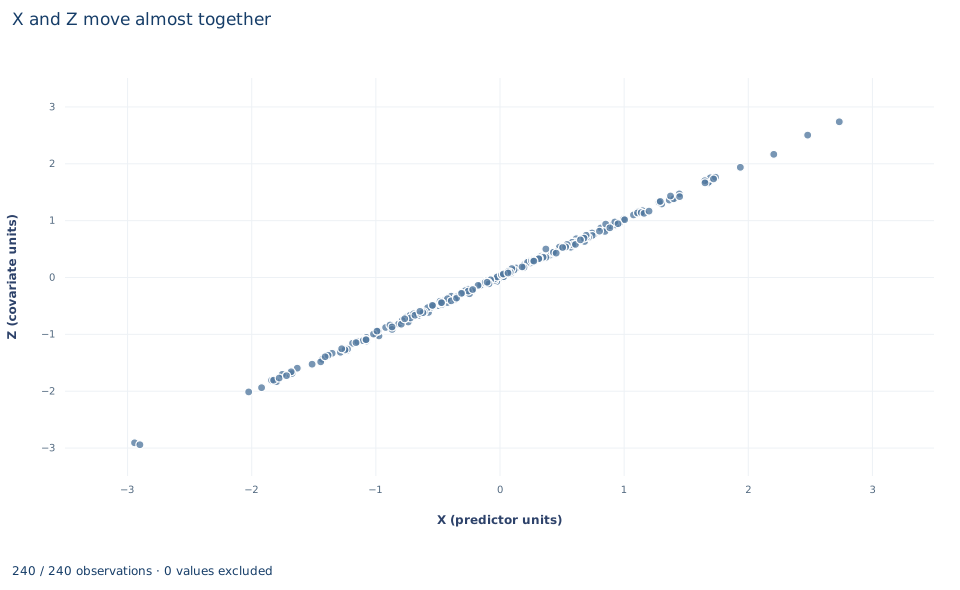
Advanced Econometrics lab 04
Collinearity, Coefficients and Stable Combinations
Why can individual slopes be uncertain while their sum is estimated well?
-
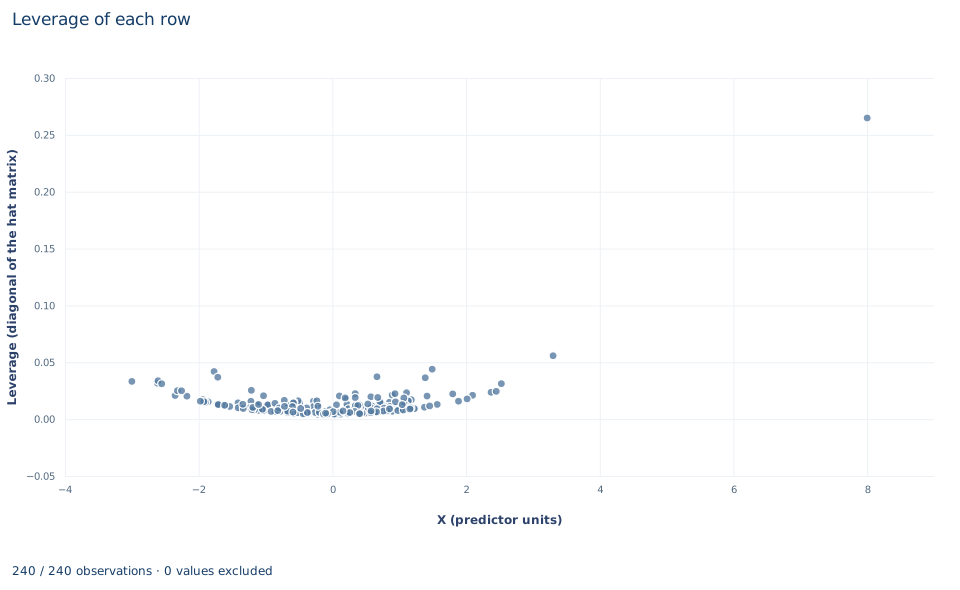
Advanced Econometrics lab 05
Leverage and Leave-One-Out Sensitivity
How do unusual predictor values affect a fit and its uncertainty?
-
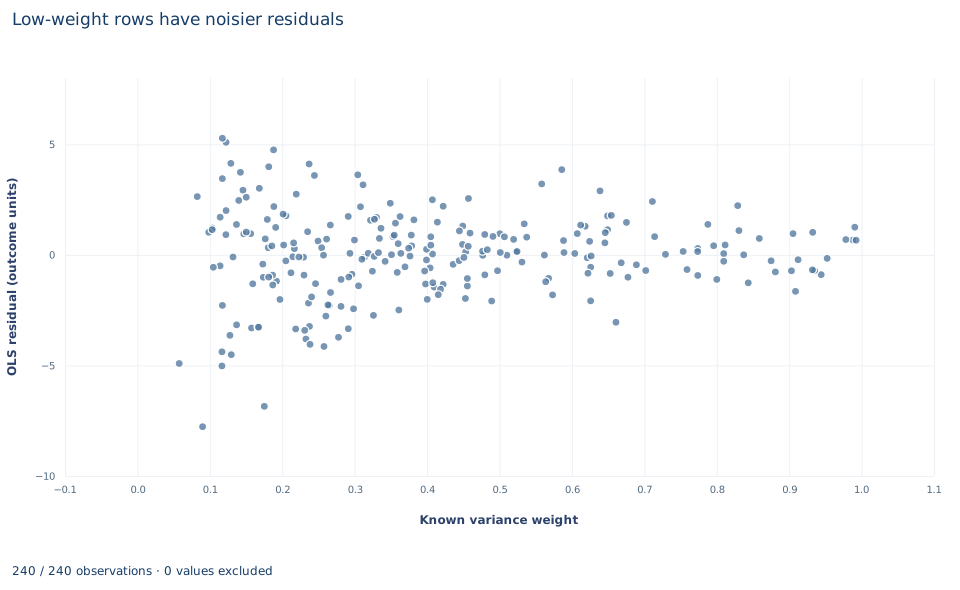
Advanced Econometrics lab 06
Known Variance Weights and WLS
How do inverse-variance weights change a least-squares fit?
-
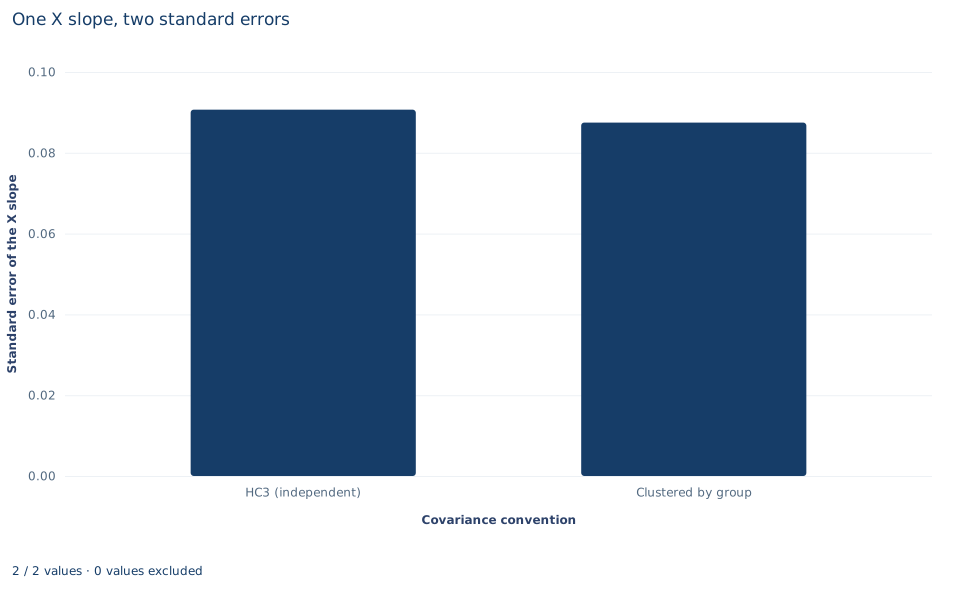
Advanced Econometrics lab 07
Clustered Errors and the Sampling Unit
Which observations provide independent information when errors share a group shock?
-
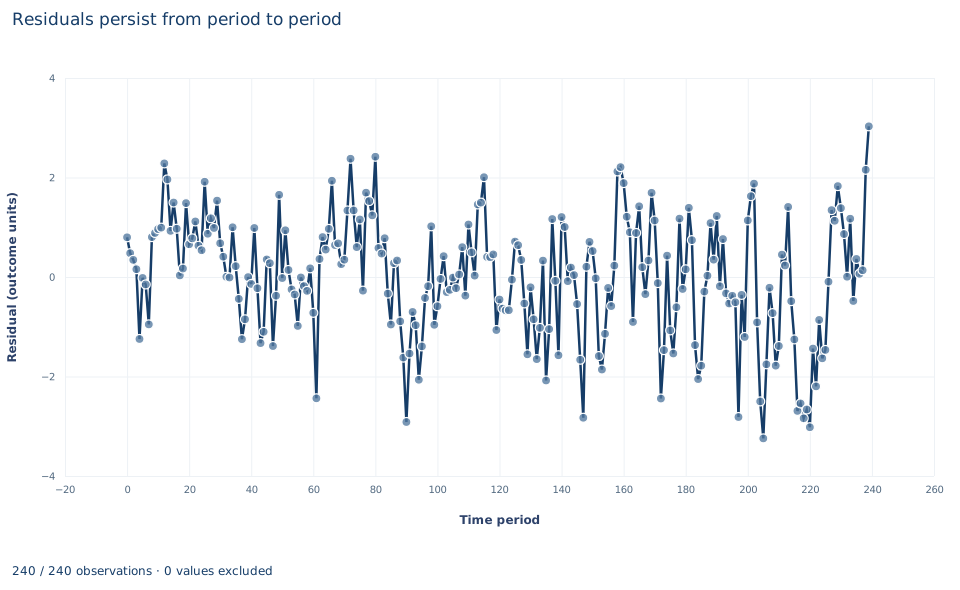
Advanced Econometrics lab 08
Serial Dependence and HAC Covariance
How can uncertainty account for correlated scores over time?
-
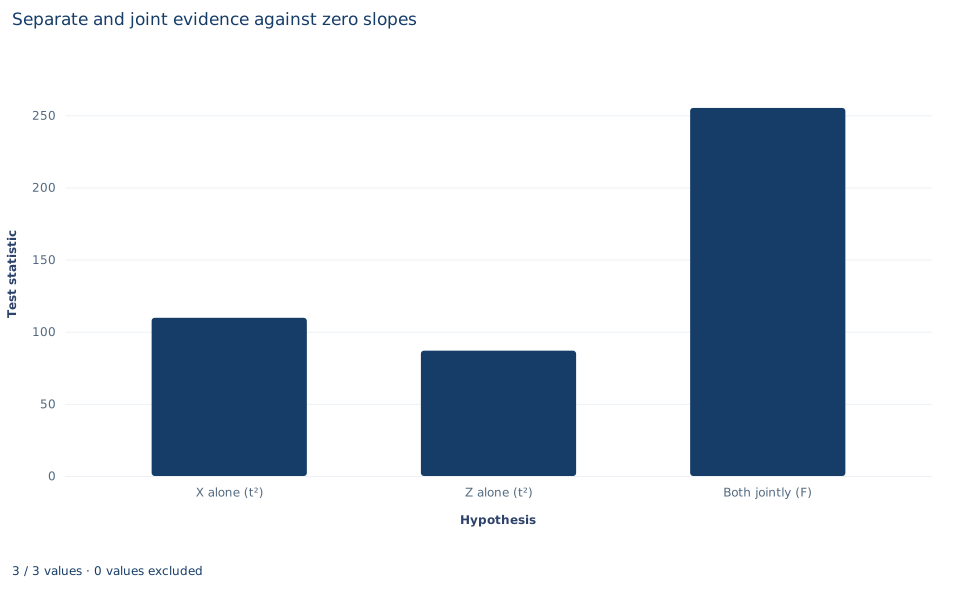
Advanced Econometrics lab 09
Joint Wald Restrictions with Robust Covariance
Why is a joint test different from reading two individual p values?
-
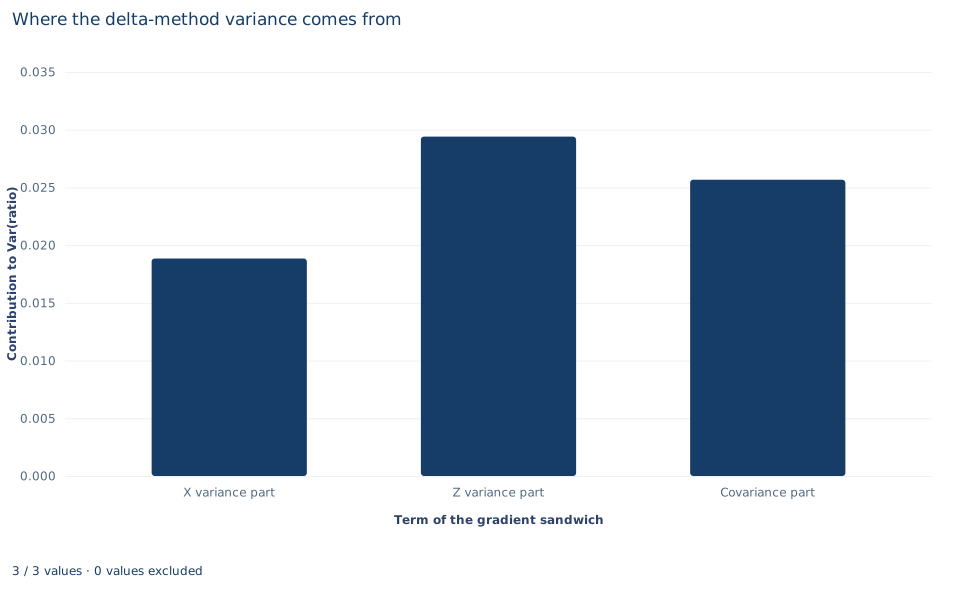
Advanced Econometrics lab 10
Delta-Method Inference for a Coefficient Ratio
How should uncertainty be propagated through a nonlinear function of coefficients?
-
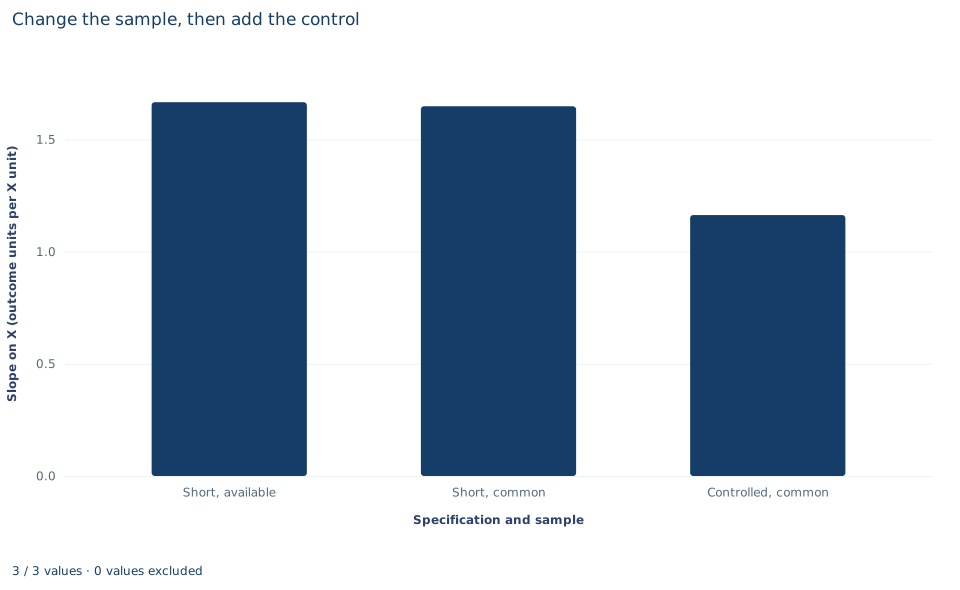
Advanced Econometrics lab 11
Specification Changes and Common Samples
When coefficients change after adding a control, how much came from changing rows?
-
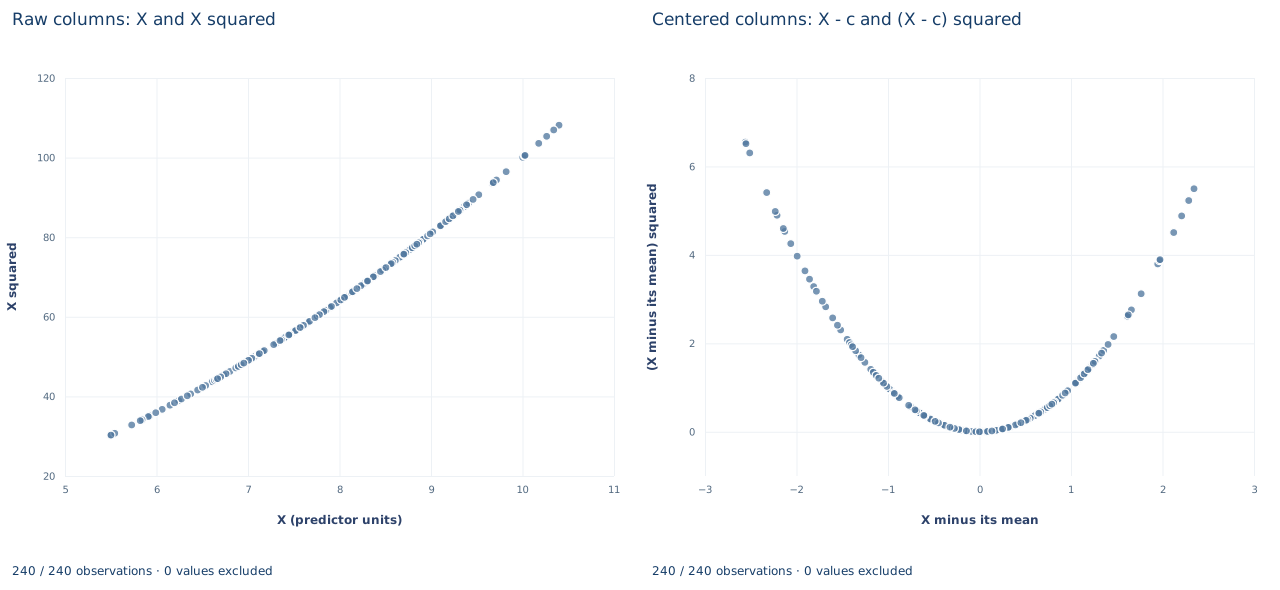
Advanced Econometrics lab 12
Centering a Polynomial without Changing Its Fit
Why does centering change coefficients while leaving a polynomial fit unchanged?
-
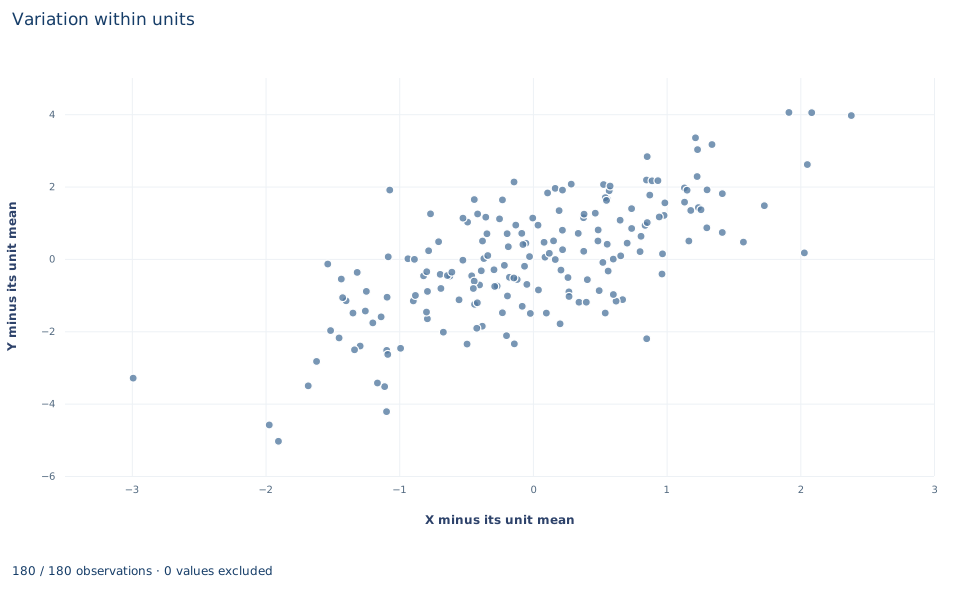
Advanced Econometrics lab 13
Fixed Effects as Dummies and Within Variation
How do unit dummies recover the same slope as within-unit demeaning?
-
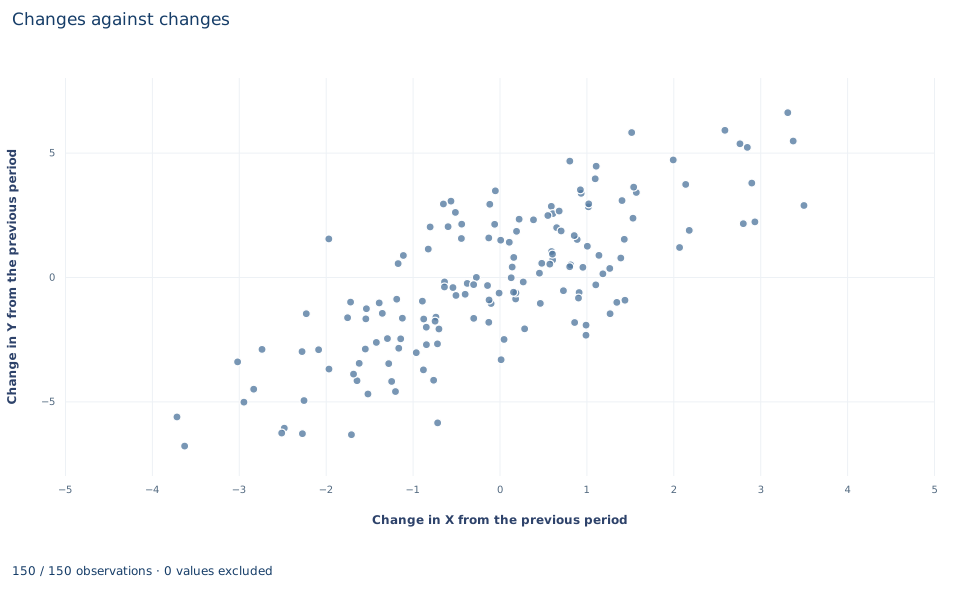
Advanced Econometrics lab 14
First Differences and Their Error Structure
What does differencing remove, and what dependence can it introduce?
-
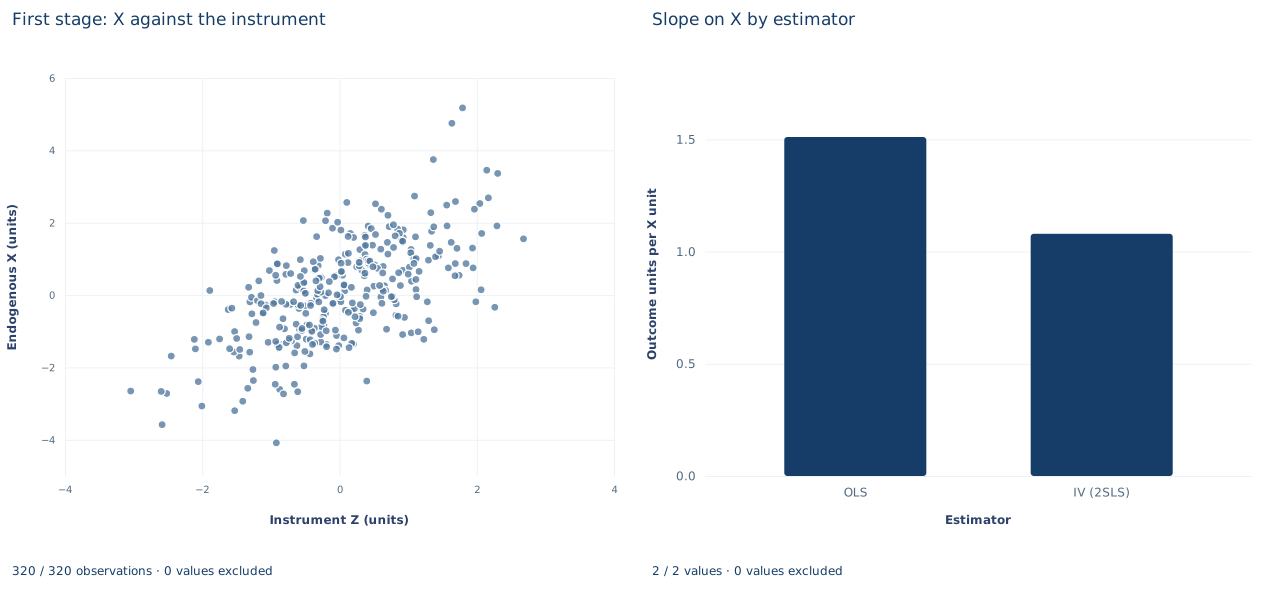
Advanced Econometrics lab 15
Instrumental Variables and the Projection Formula
How does an instrument isolate exposure variation that is orthogonal to the structural error?
-
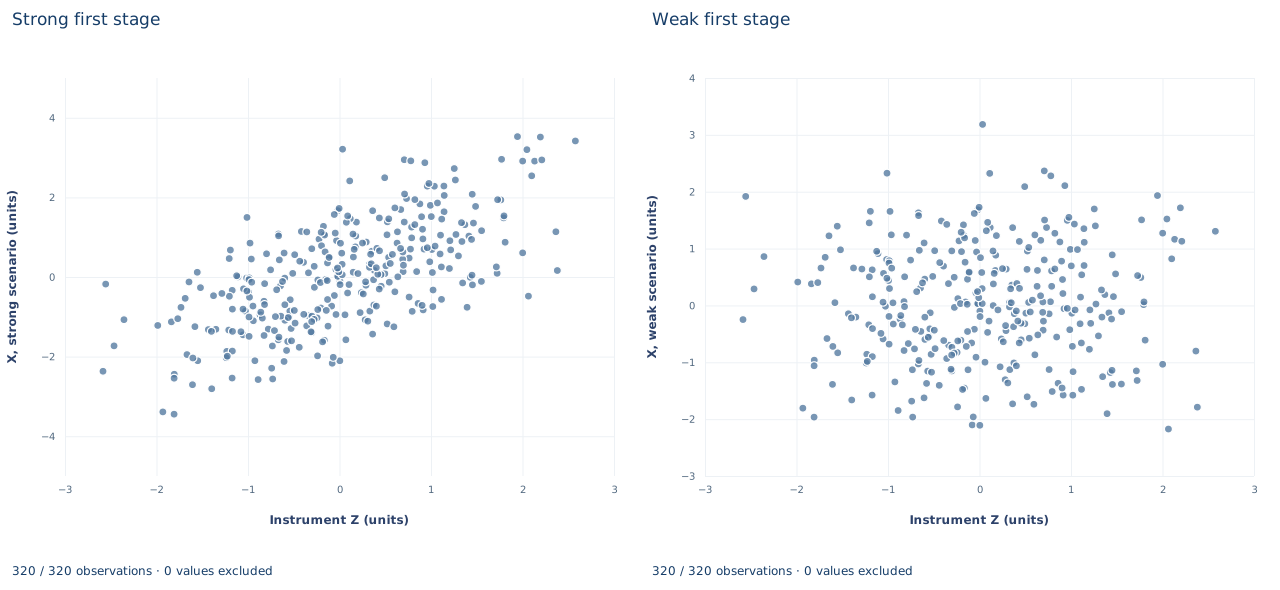
Advanced Econometrics lab 16
Weak Relevance and IV Sensitivity
What changes when an otherwise valid instrument barely predicts exposure?
-
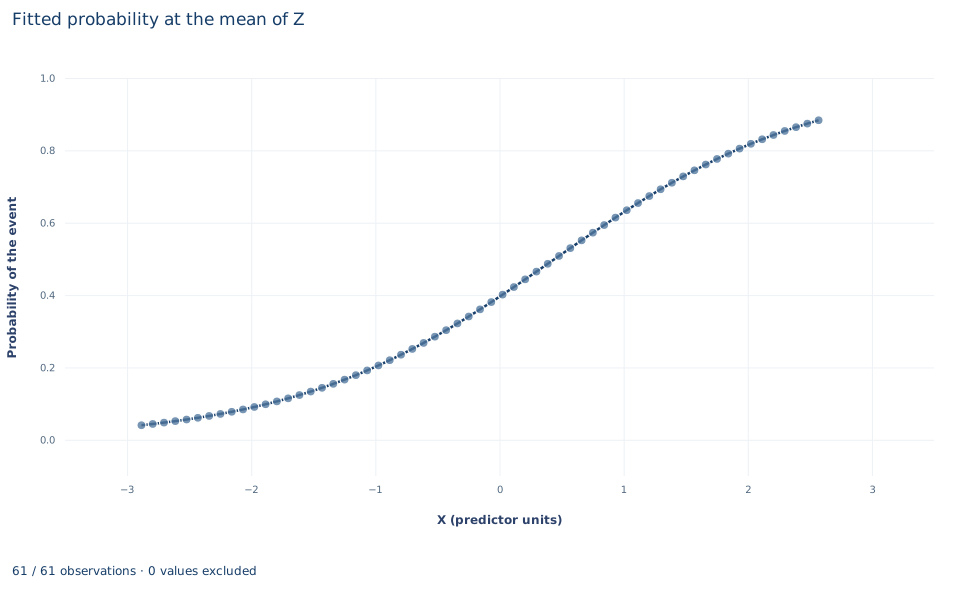
Advanced Econometrics lab 17
Logit Probabilities, Odds and Marginal Effects
Why is a logit coefficient not a probability change?
-
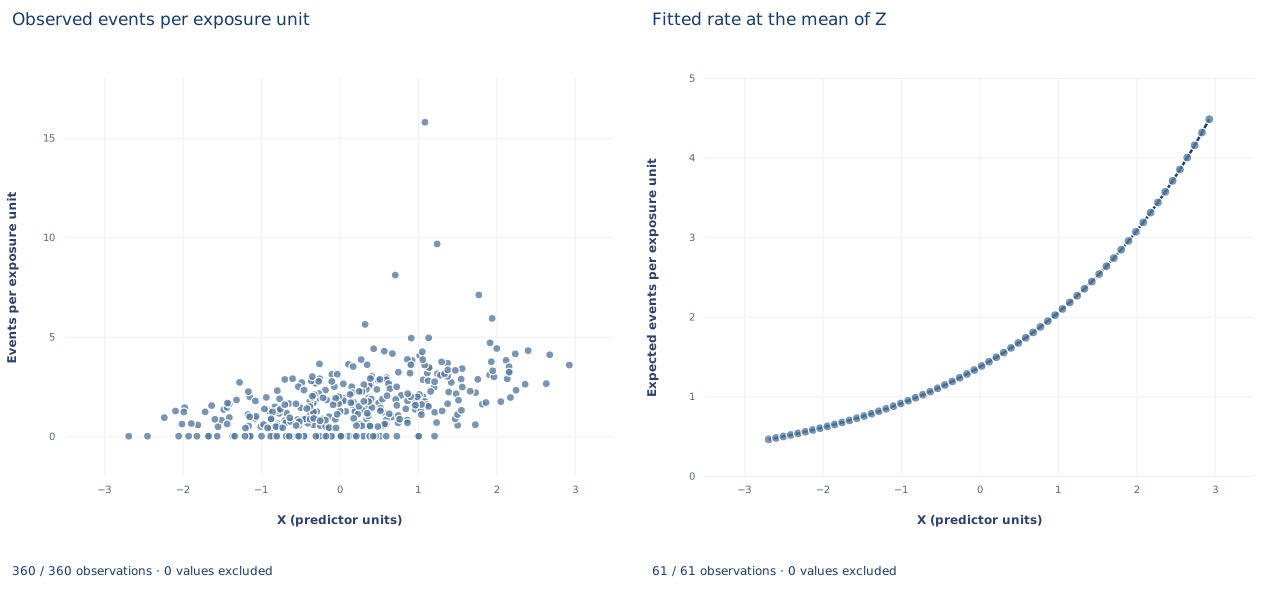
Advanced Econometrics lab 18
Poisson Rates with an Exposure Offset
How can counts from different observation exposures be compared?
-
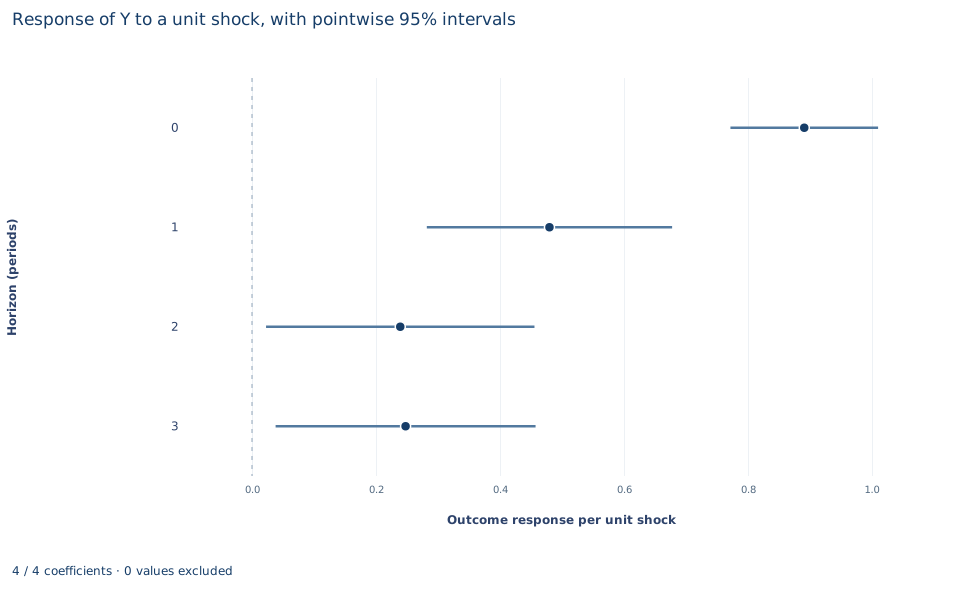
Advanced Econometrics lab 19
Local Projections over Several Horizons
How can horizon-specific regressions trace the response to an exogenous shock?
-
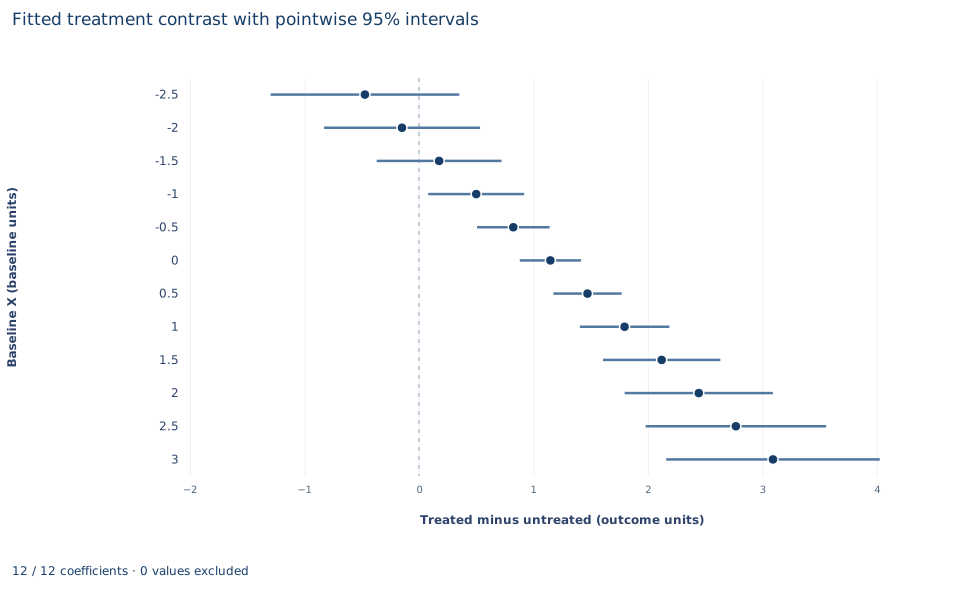
Advanced Econometrics lab 20
A Reproducible Treatment-Effect Report
How should a report retain its estimand, sensitivity specifications and full evidence?
Nothing matches yet. Try a shorter search, or another kind of page.
Try it on your own data
OpenEconometrics is free and open source under Apache 2.0. Install the Python library or download the desktop alpha.
pip install openecon